

Key Findings
-
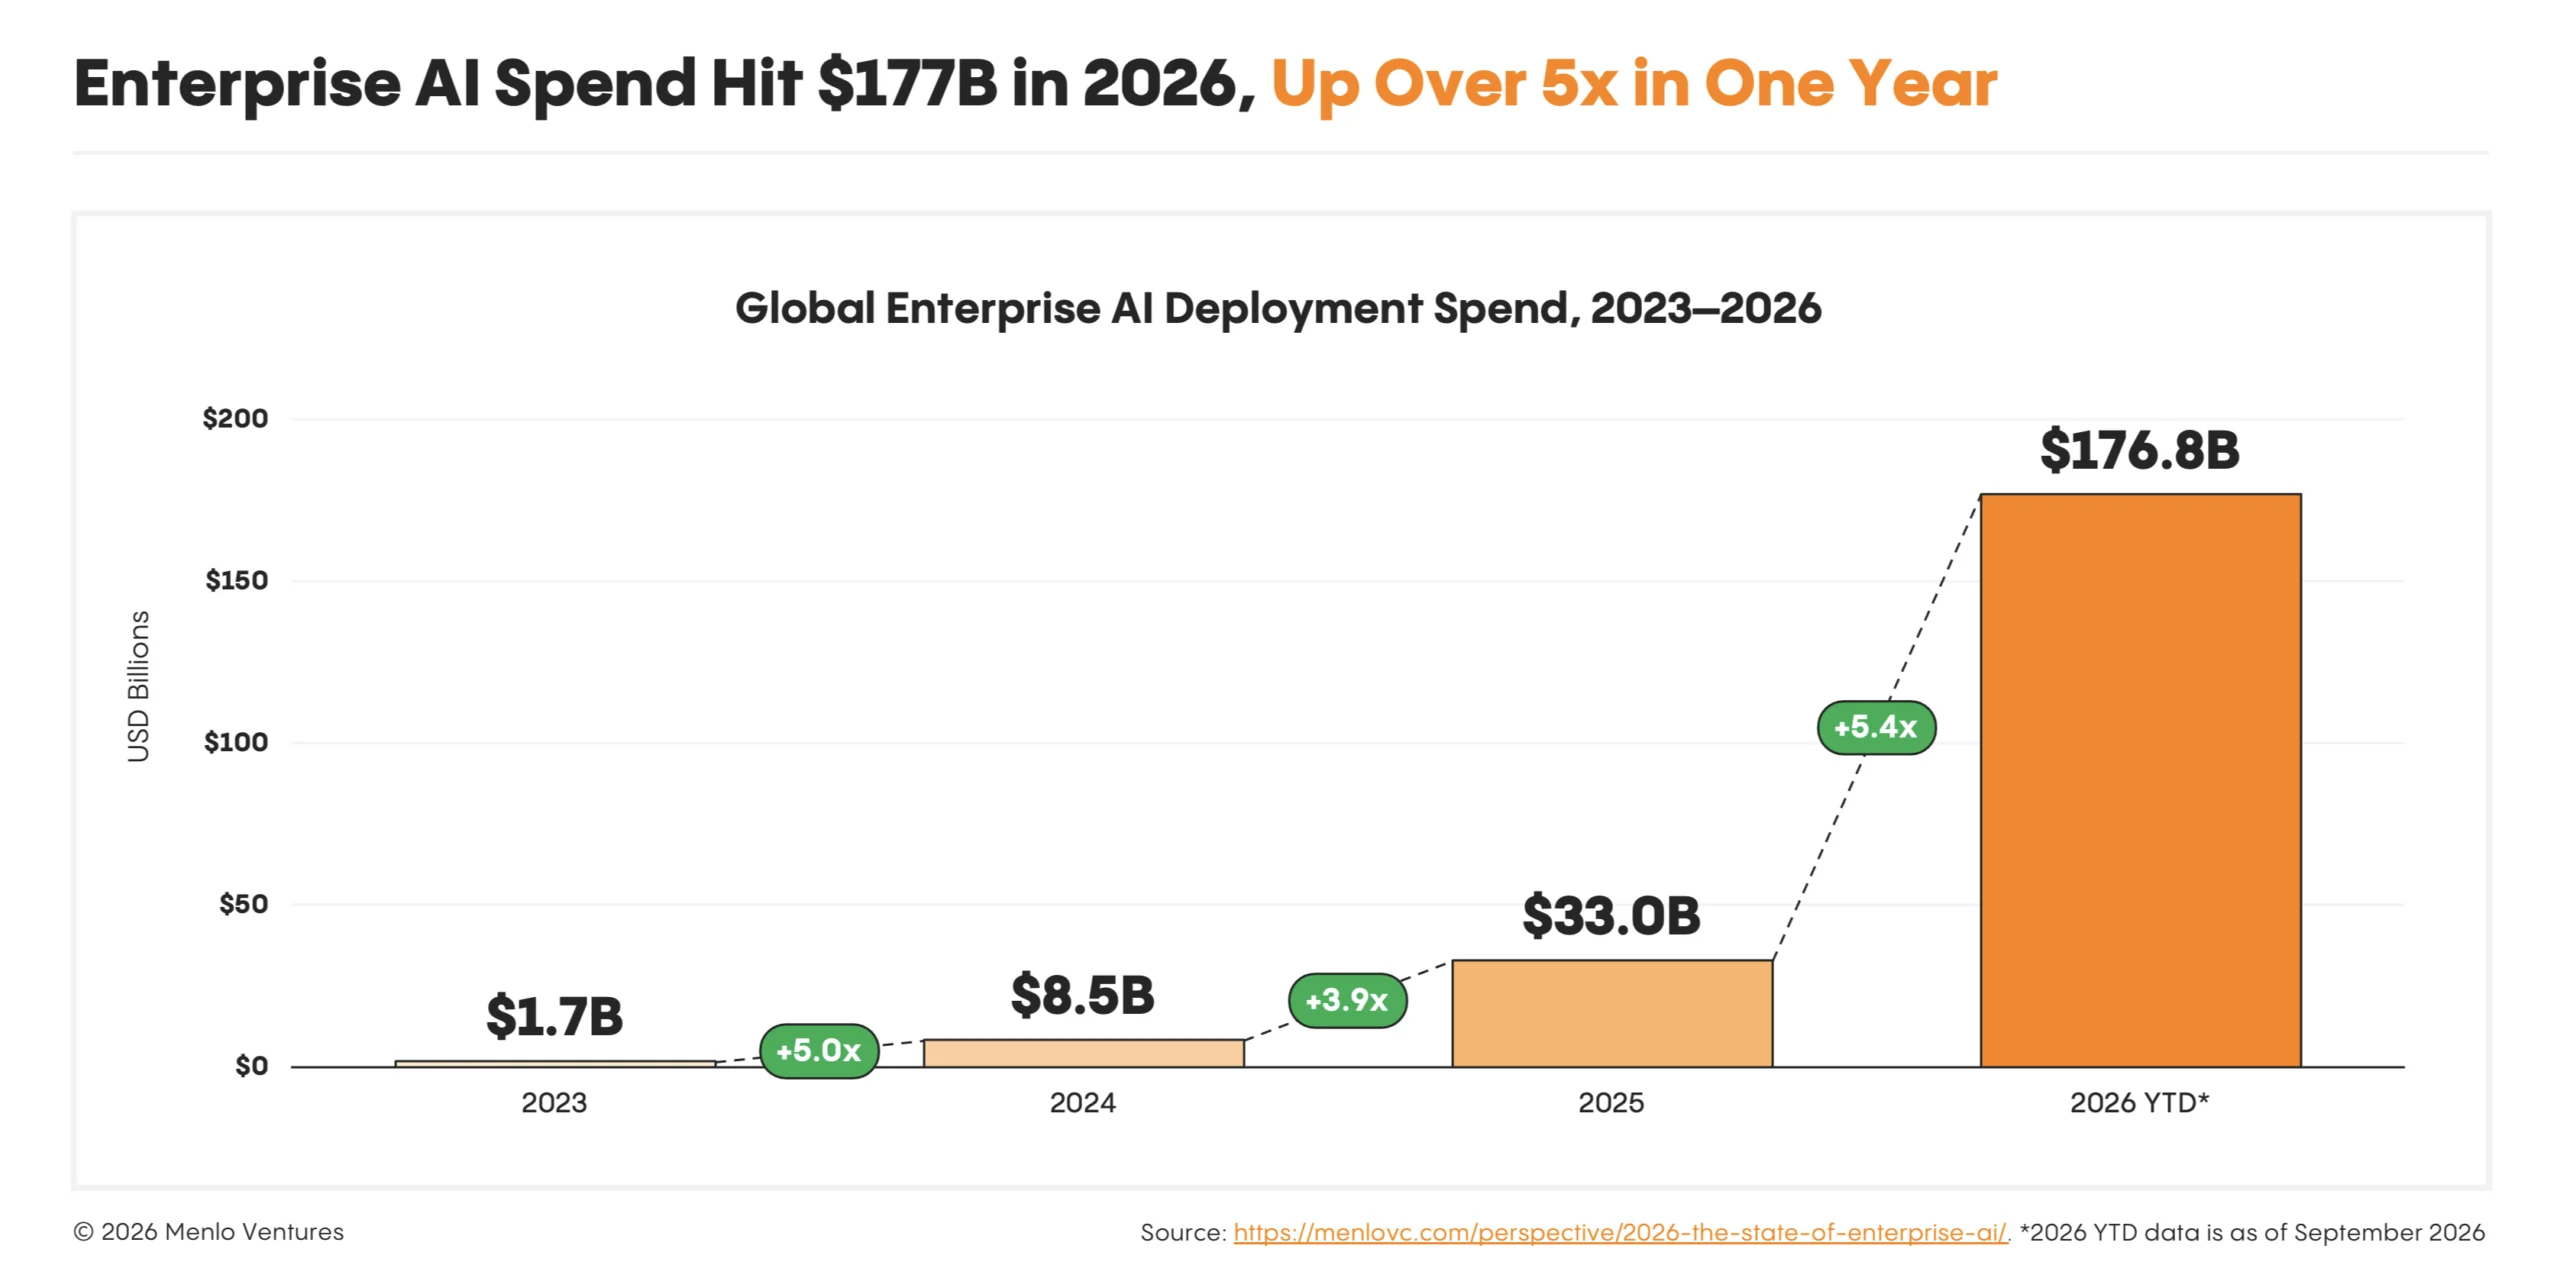
Enterprise AI deployment spend scaled to $177B by September 2026, up from $33B last year. Growth is accelerating: 5.4x vs. 3.9x a year ago. Every dollar that went into developing models this year is generating $1.70 of revenue.
-
Agents changed the math: OpenRouter agent traffic is up 37x since overtaking human traffic in February, tying spend to work performed rather than users.
-
For now, money follows capability: Frontier labs command 69% of deployment dollars (vs. 50% last year). Anthropic’s share of enterprise API spend increased from 40% to 55%, OpenAI’s from 27% to 31%, while Google’s fell from 21% to 9%. Open-source remains 4% of spend despite 19% of usage.
-
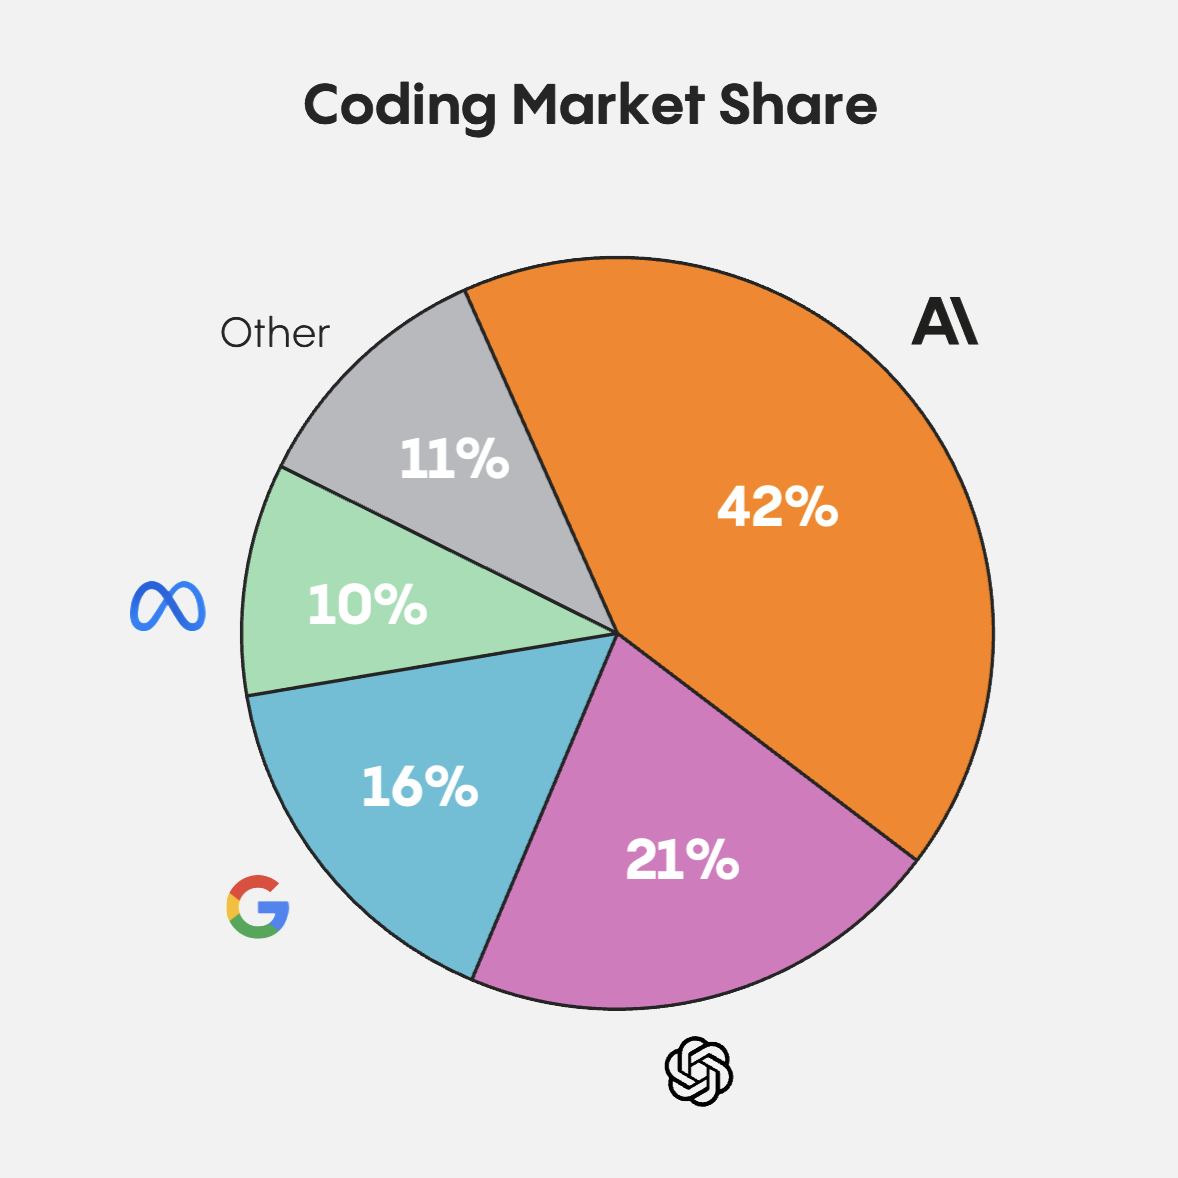
AI spend concentrates where agents work best: Coding ($34.0B) and chatbots ($25.0B) make up 76% of the $77.3B app market because they offer environments in which agents can act, workflows they can learn, and results they can verify.
-
AI-natives are winning new agent categories like coding, which is 96% AI-native. Compared to last year, incumbents are gaining share in IT (91%), data science (88%), and HR (68%).
-
AI is expanding the software economy: 55% of AI dollars is from net new spend, rather than existing software or labor budgets.
Enterprise AI Reaches Scale
In 2026, AI became an economy-scale force. Enterprise AI deployment spending surged from $33 billion to $177 billion in just one year. That’s over $140 billion in new annual spending, more than four times the size of the entire market a year ago.
The speed of AI’s rise set off alarms. Fears that AI would replace traditional software triggered a “SaaSpocalypse” selloff earlier this year, while others worried it would eat into labor budgets.
But our data tells a different story: Far from being a zero-sum game, AI is creating new value across the economy, expanding markets far more than it’s displacing existing revenue.
- Agents expand the software market. Progress in agents unlocked work software couldn’t do before, already paying back massive investments in model development: $1.70 of deployment AI revenue for every $1 going to training. New budgets funded 55% of the incremental AI spend, rather than existing software or labor budgets.
- Open-source gains alongside frontier growth. Frontier lab share of deployment spend grew from 50% to 69%, but open-source models’ share of usage rose from 11% to 19% as well. Spend remains small, but interest suggests significant further growth.
- Independent apps grow alongside the labs. The labs’ coding agents grew from $1B to $24B, yet the rest of the coding market still grew 2.9x to $10B. Even excluding the labs’ own apps, the largest app markets are the ones the labs target most: coding, AI assistants ($9.5B) and healthcare ($3.7B).
Part I. The Agent Inflection
Agents Have Grown to 80% Of AI Usage
The biggest story of the past year has been the rise of AI agents. The launch of Anthropic’s* Opus 4.5 in November 2025 marked an inflection point as the model—for the first time—allowed AI to move beyond answering questions in conversational turns to executing complex, multi-step tasks with limited human oversight.
Since then, agents have now grown to become the biggest consumers of AI models. On OpenRouter*, a platform that gives developers access to hundreds of AI models, they now account for 80% of all tokens, roughly 7x human-driven usage.
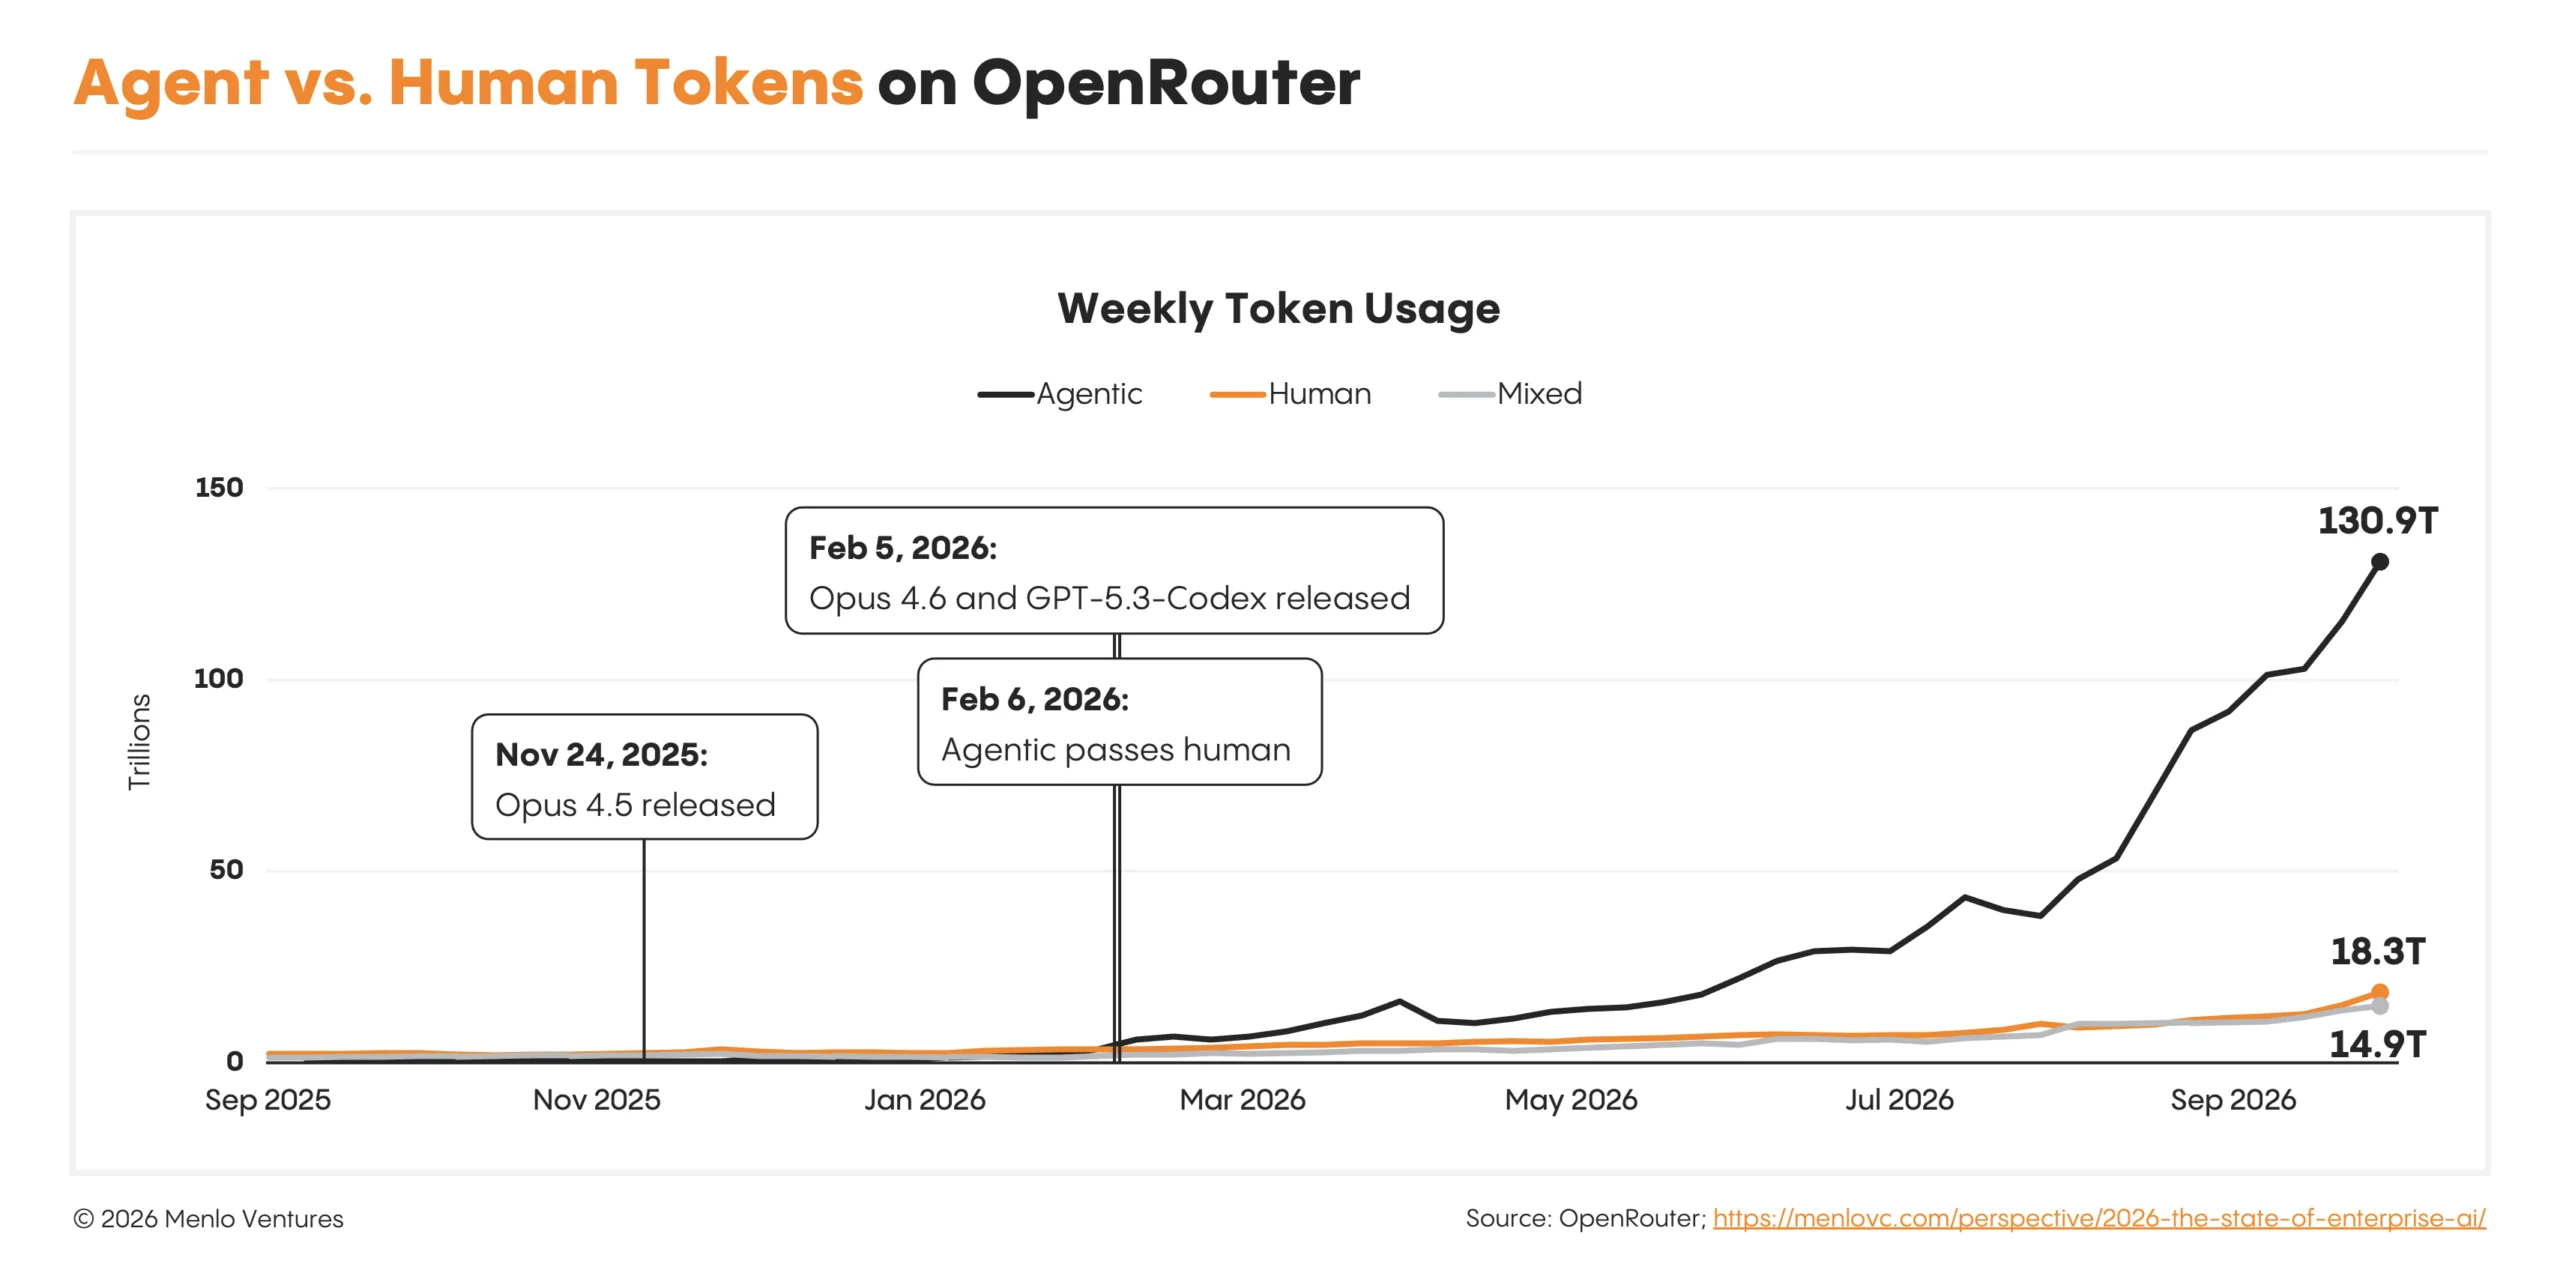
Agent traffic tripled the week after Opus 4.5’s launch, then overtook human traffic in early February following the launches of Opus 4.6 and GPT-5.3-Codex. Since then, it has grown 37x, vs. 5x for human-driven usage. OpenRouter is just one channel, but it shows how quickly AI consumption is shifting from humans asking questions to machines doing work.
Leading AI apps rebuilt around this new autonomy: Harvey and Legora* each re-architected contract review from a fixed workflow into a multi-agent system, and Sierra launched Horizon, a platform for agents that pursue goals over days or weeks, like originating a loan. Factory*, whose Droids already worked autonomously, also took off with the new models—doubling revenue month over month for six straight months through April 2026.
AI Labs Capture 69% of Every Enterprise AI Dollar
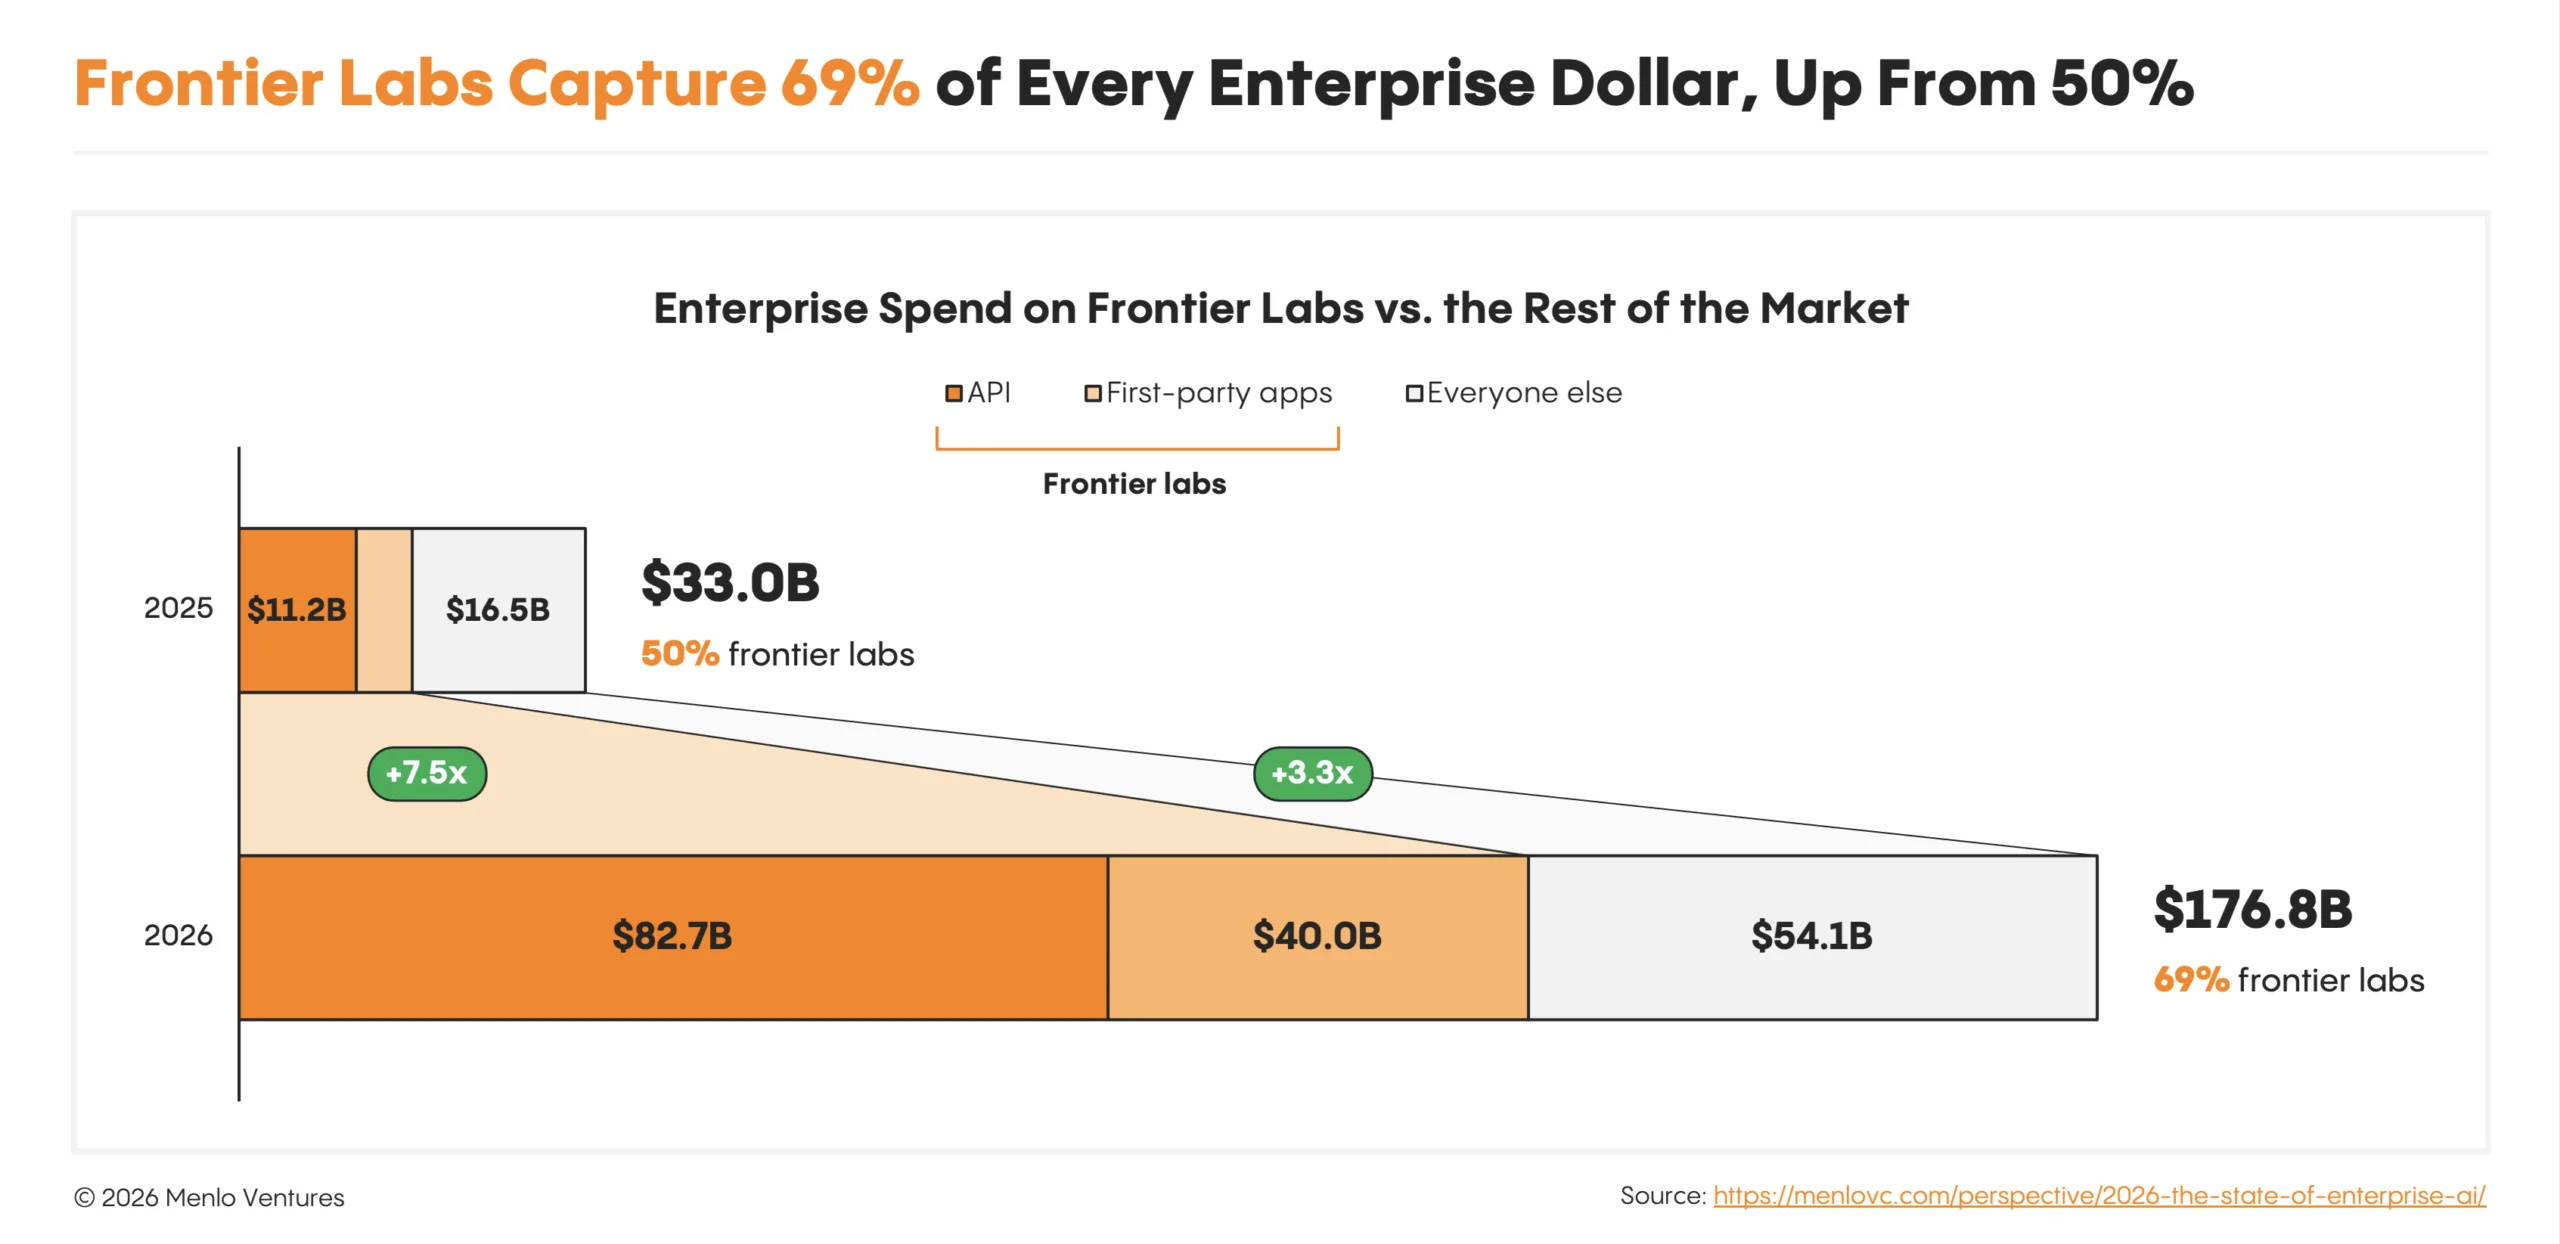
As agents take on more work, buyers are paying a premium for the most capable models, even as much cheaper options have become available. We estimate Anthropic, OpenAI, and Google command $122.7B of enterprise spend—69% of all deployment dollars, up from 50% last year and 2.3x the rest of the market combined.
Concentration is not just at the API layer. The labs’ first-party apps also dominate the app layer and now total $40.0B: Claude Code and Codex account for $24.0B (70%) of coding spend, while enterprise Claude, ChatGPT, and Gemini make up $15.5B (62%) of the AI chatbot and productivity spend.
For now, the money follows model progress. Value accrues to the labs that introduce a new capability like long-horizon agents, and the initial apps they build around it. Over time though, we expect this concentration to ease as the capability matures and application companies bring it to new markets.
Anthropic Leads in an Increasingly Two-Horse Race
In the race to win AI builders, Anthropic and OpenAI now account for 86% of enterprise LLM API spend, up from 67% last year. As the market consolidates around the frontier leaders, model capability—not price—is proving to be the decisive competitive advantage.
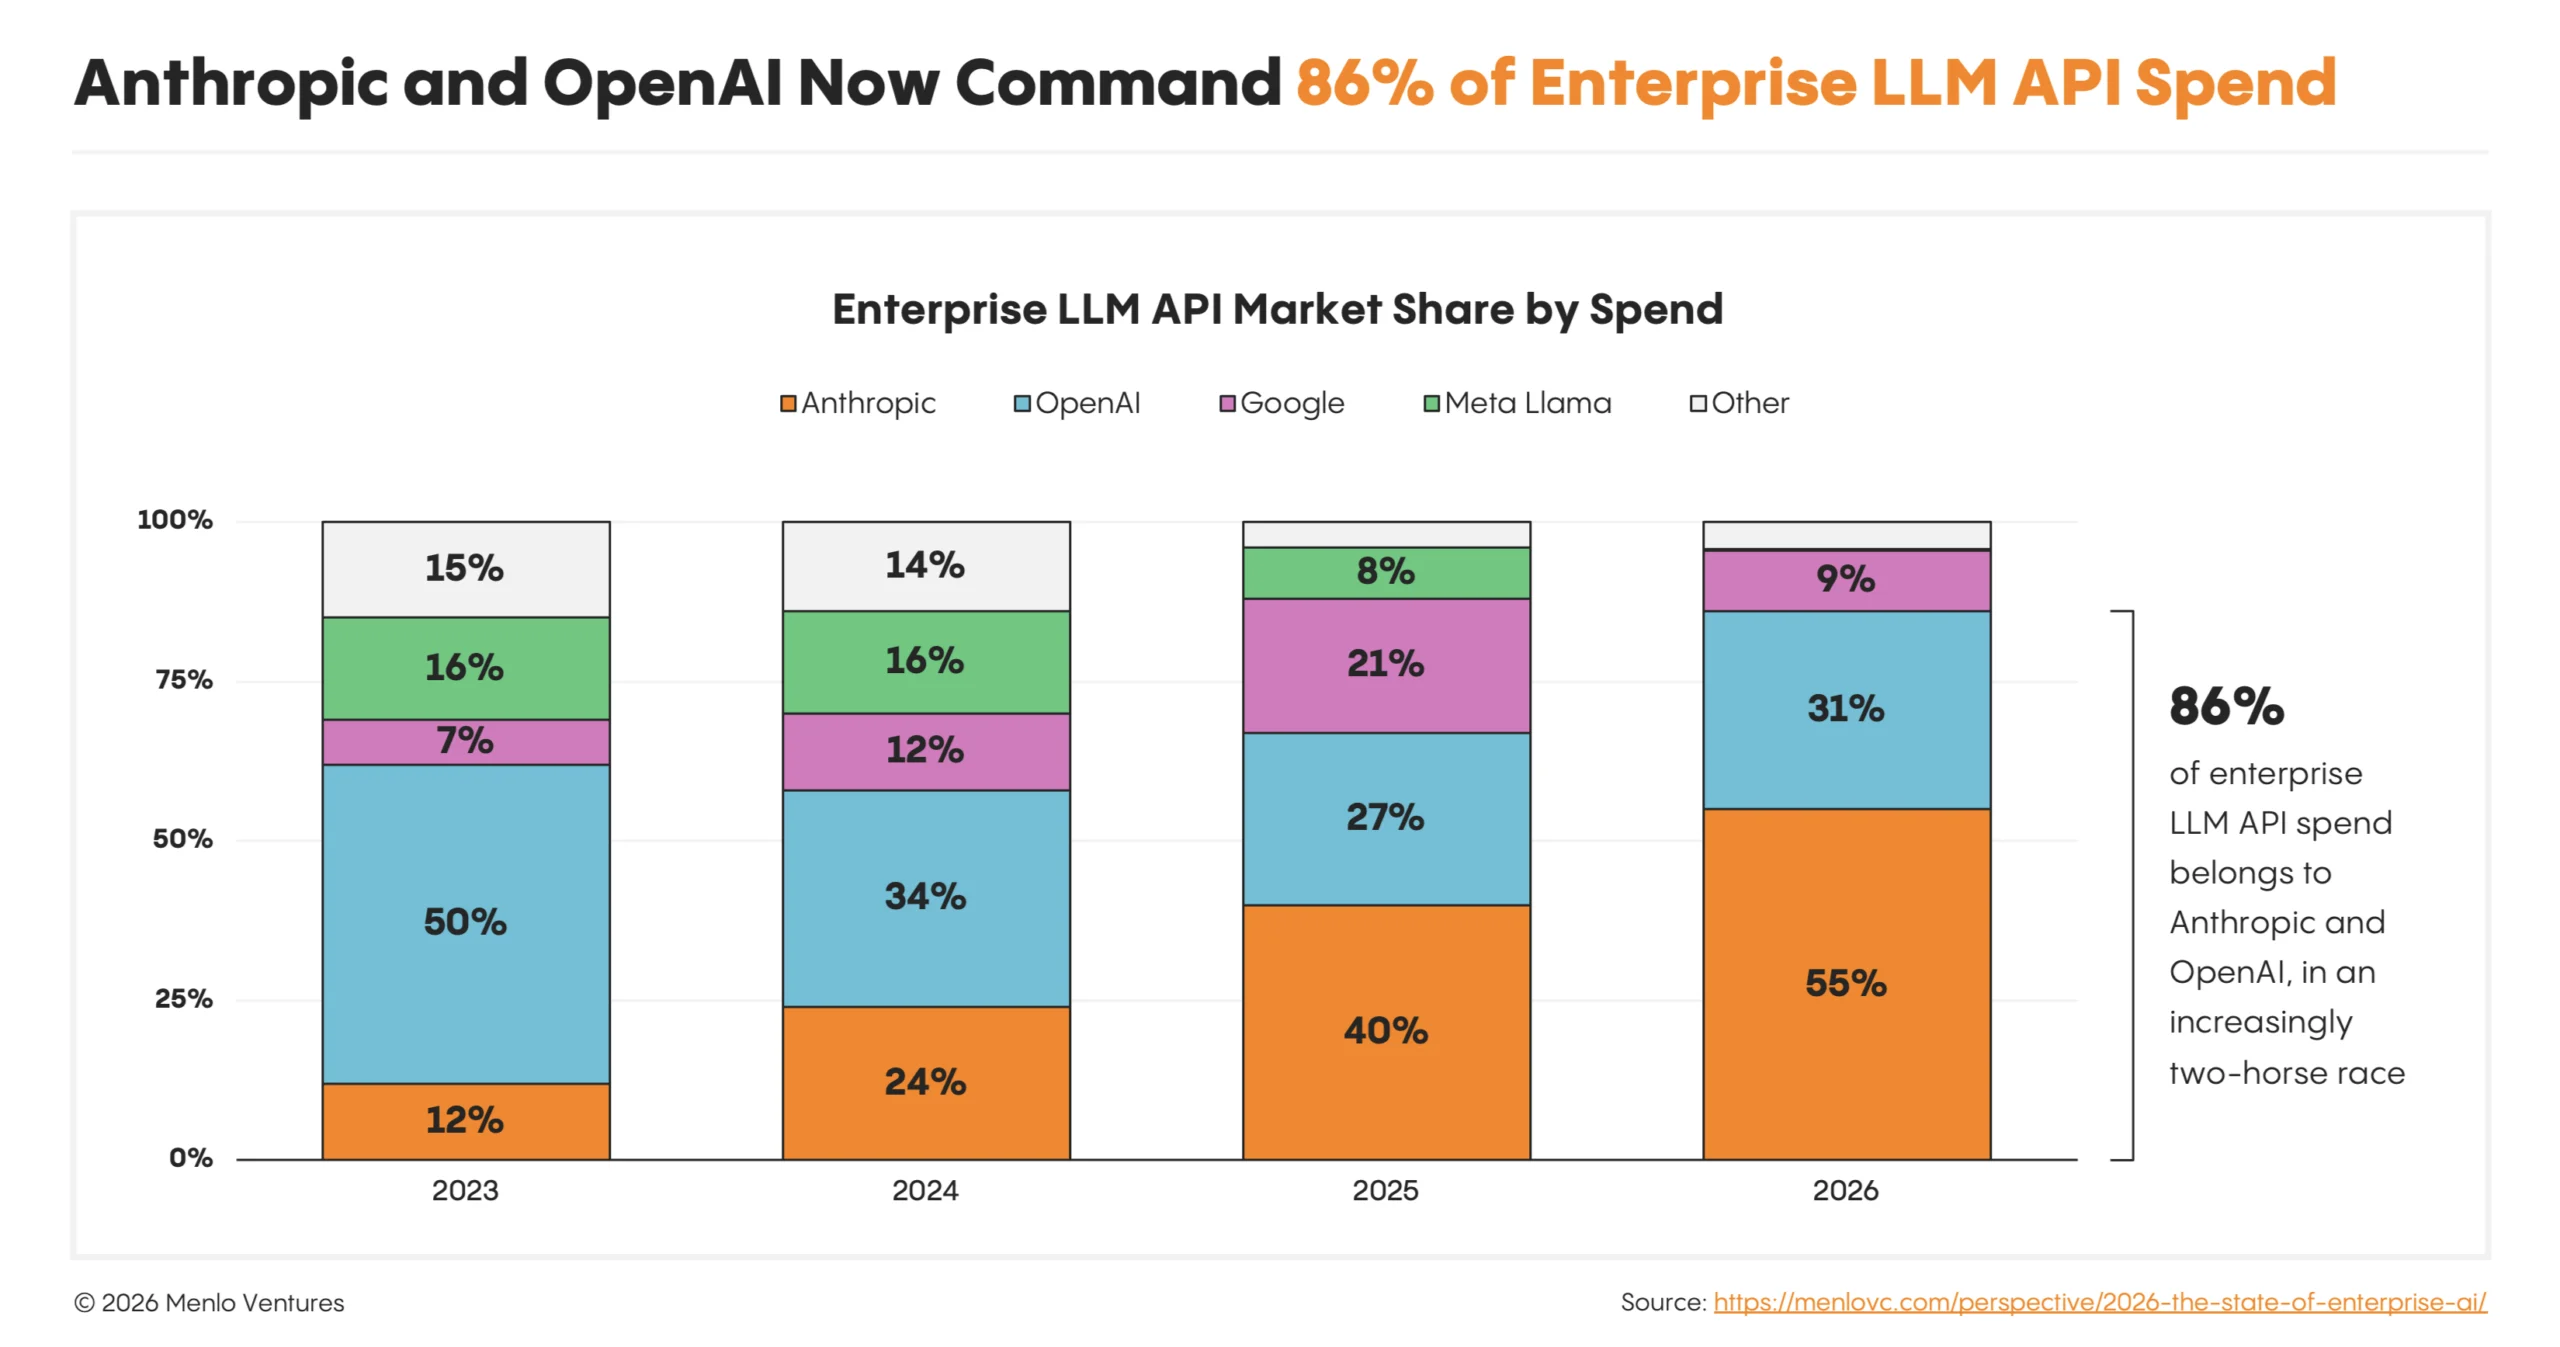
- Anthropic widened last year’s lead, growing from 40% to 55% on the strength of its Opus models, which excel at long-horizon tasks and coding in particular.
- OpenAI also gained share, from 27% to 31%, with a particularly strong second half of the year driven by the release of its GPT-5.6 models (Sol, Terra, Luna) in July and GPT-6 in September.
- Google fell furthest, from 21% to 9%. Gemini 3 Pro put the lab at the frontier in November 2025, but Google hasn’t matched Anthropic’s and OpenAI’s flagship models since, and its API spend now skews toward cheaper Flash models.
- Near-frontier models haven’t broken through. xAI’s Grok 4.7 and open-source models like Moonshot’s Kimi K3, DeepSeek’s V4, and Z AI’s GLM-5.3 approach frontier performance at a fraction of the price, yet together hold just under 5% of LLM API spend.
AI Spending Blows Past Budgets as Agents Drive Demand
The average enterprise planned to nearly double their AI spend in 2026. They ended up paying far more.
Reported spending averaged 4.7x last year’s level, against a planned 1.9x—roughly 2.5x plan. Median spending also exceeded expectations, though not nearly as dramatically: Spend reached 2.2x last year’s level against a 1.8x expectation. The difference between average and median reflects AI’s “fat head”: a small group of power users accounts for a disproportionate share of AI spend and grew far faster than most enterprises.
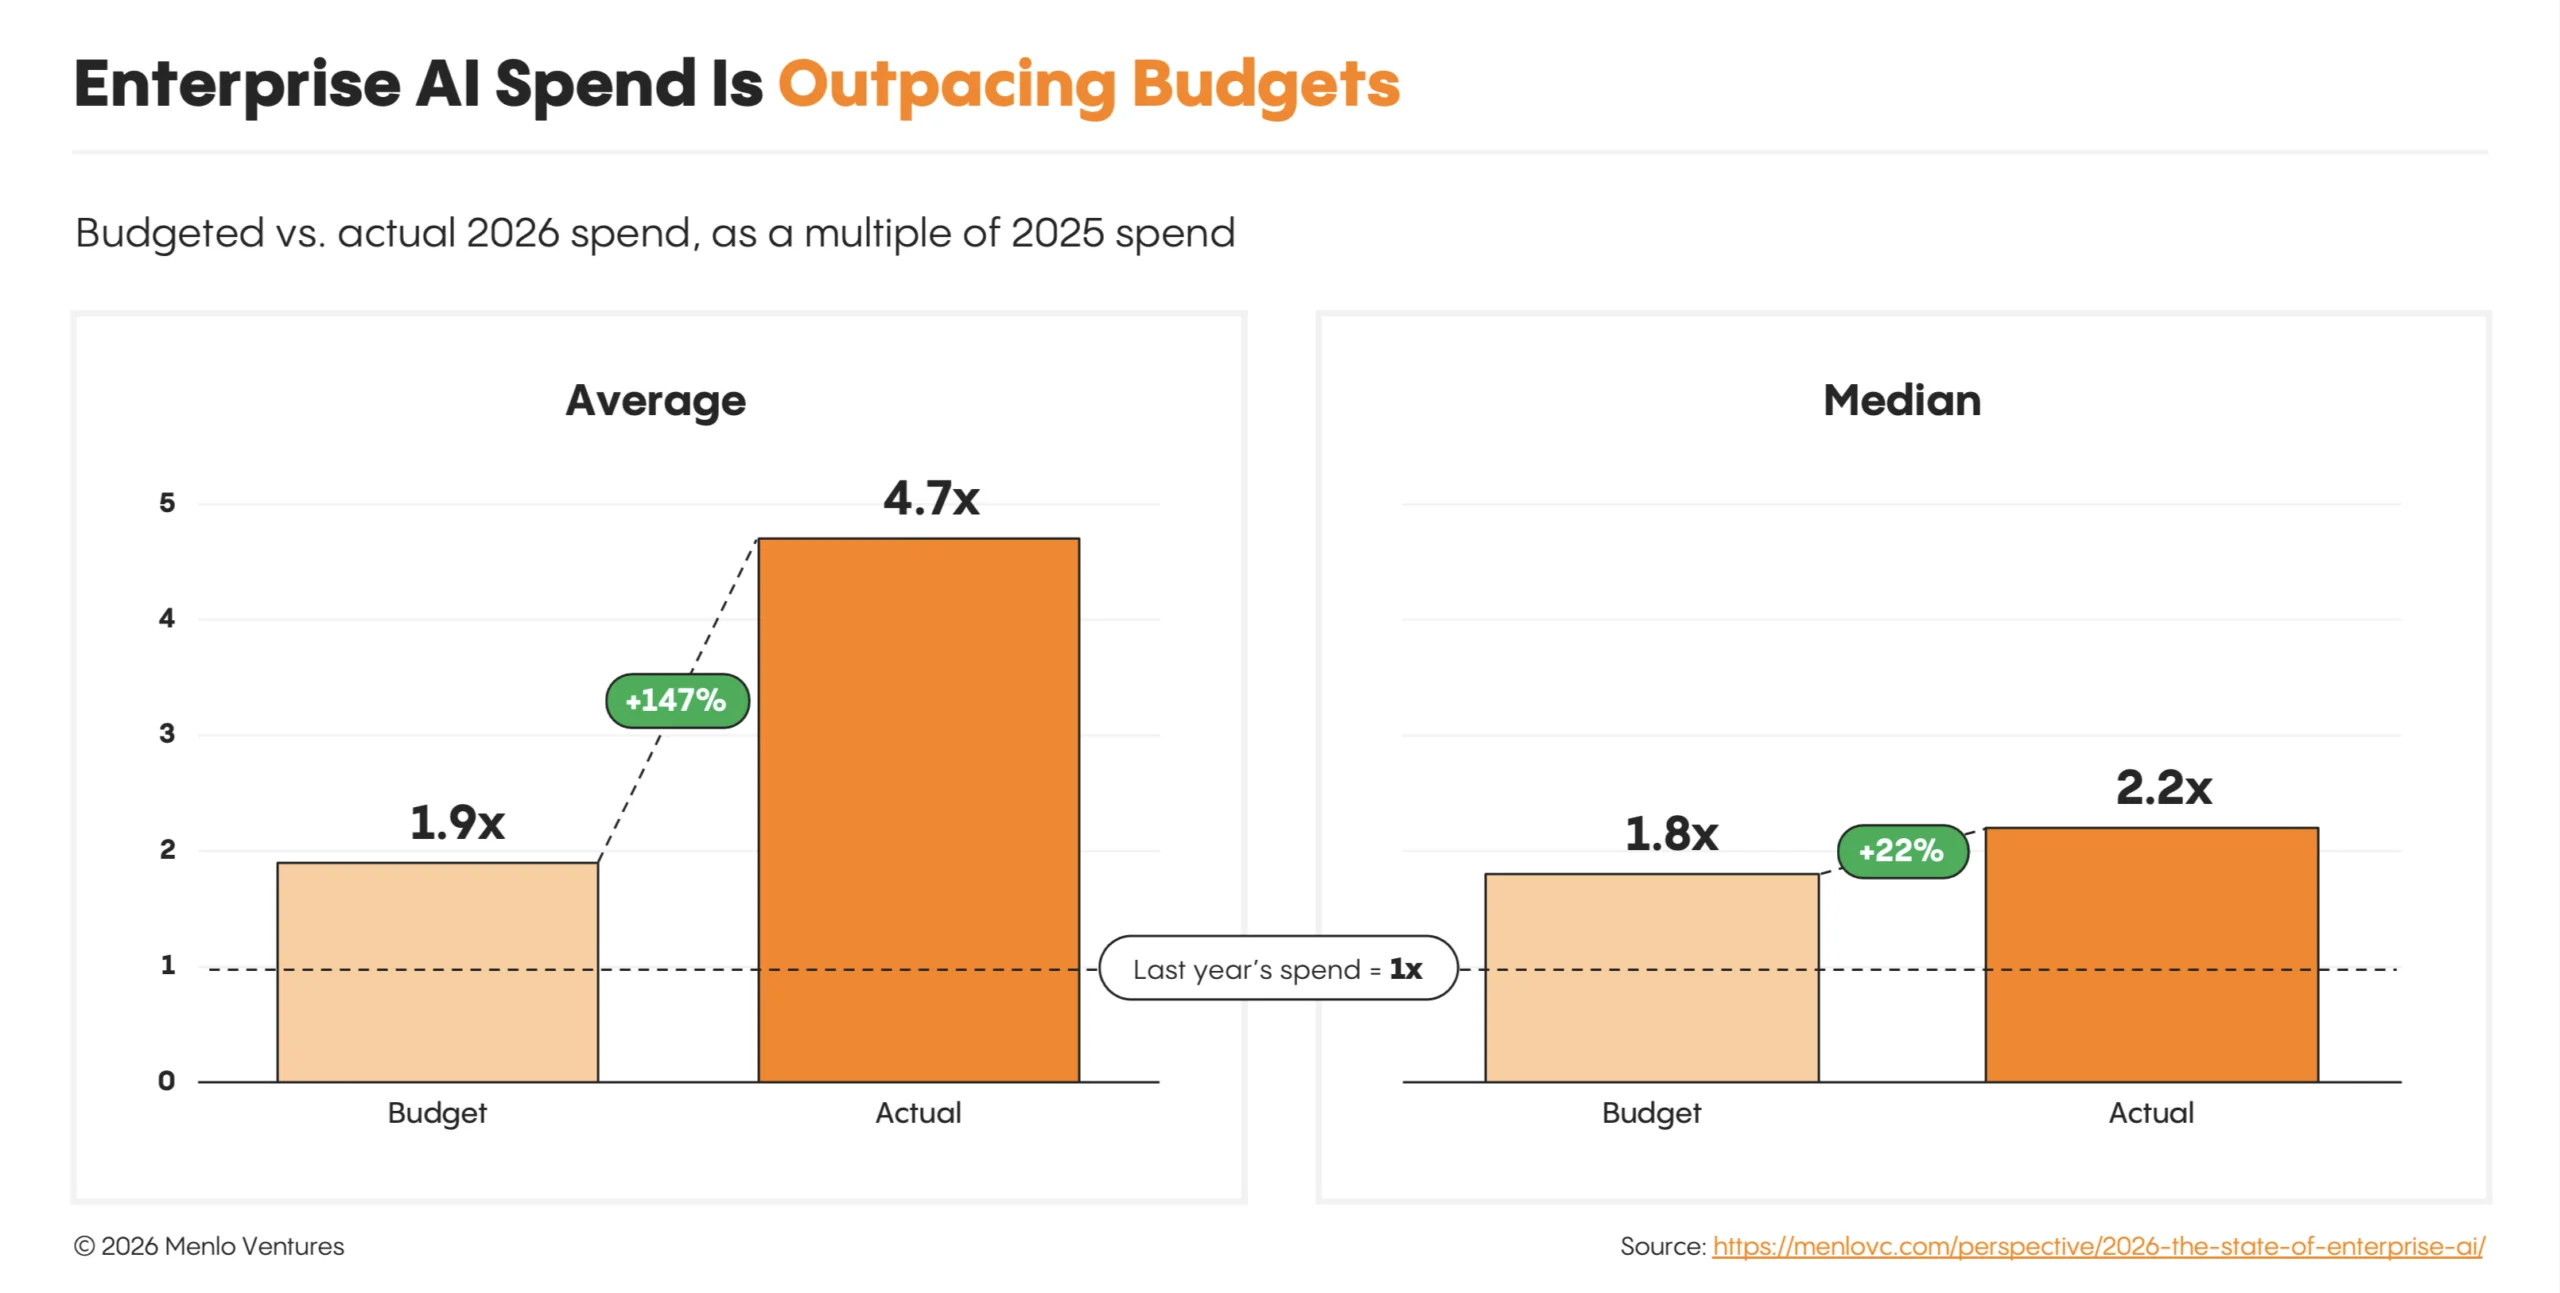
As for the difference between actual and planned spend, agents explain the gap. They work independently, run in parallel, and keep going even after people step away, so spending scales with work rather than headcount. This growth was the key driver of the AI market inflection this year: Spend per enterprise nearly quintupled while adoption among enterprises rose only from 55% to 65%.
Looking forward, we read this as an encouraging sign of sustained future demand: With so much AI spend coming from power users, both adoption and usage still have significant room to grow across the long tail of the rest of the economy.
AI Is Growing the Software Market, Not Eating It
At $176.8B, AI deployment spend now equals more than 30% of public cloud revenue, up from just 6% a year ago. Where is that money coming from?
Mostly new budgets, which funded 55% of incremental AI spend, compared with 22% from software budgets—though even with that, most (13%) stayed with incumbents converting SaaS licenses to AI, like Microsoft Office to Copilot, while only 9% ($12.6B) moved to AI-native vendors, about a 2-point growth headwind for the $600B+ application SaaS market (from +13% last year to +11% this year).
Our study also found limited evidence of enterprises replacing core systems such as Salesforce’s CRM, Workday’s HRIS, or Oracle’s NetSuite with AI. In other words, AI is significantly expanding the overall software market while modestly slowing growth for traditional SaaS. The question for these incumbents moving forward will be whether their new AI products can win enough incremental spend to avoid decelerating growth alongside the SaaS market.
More Money Goes into Using AI Than Building It
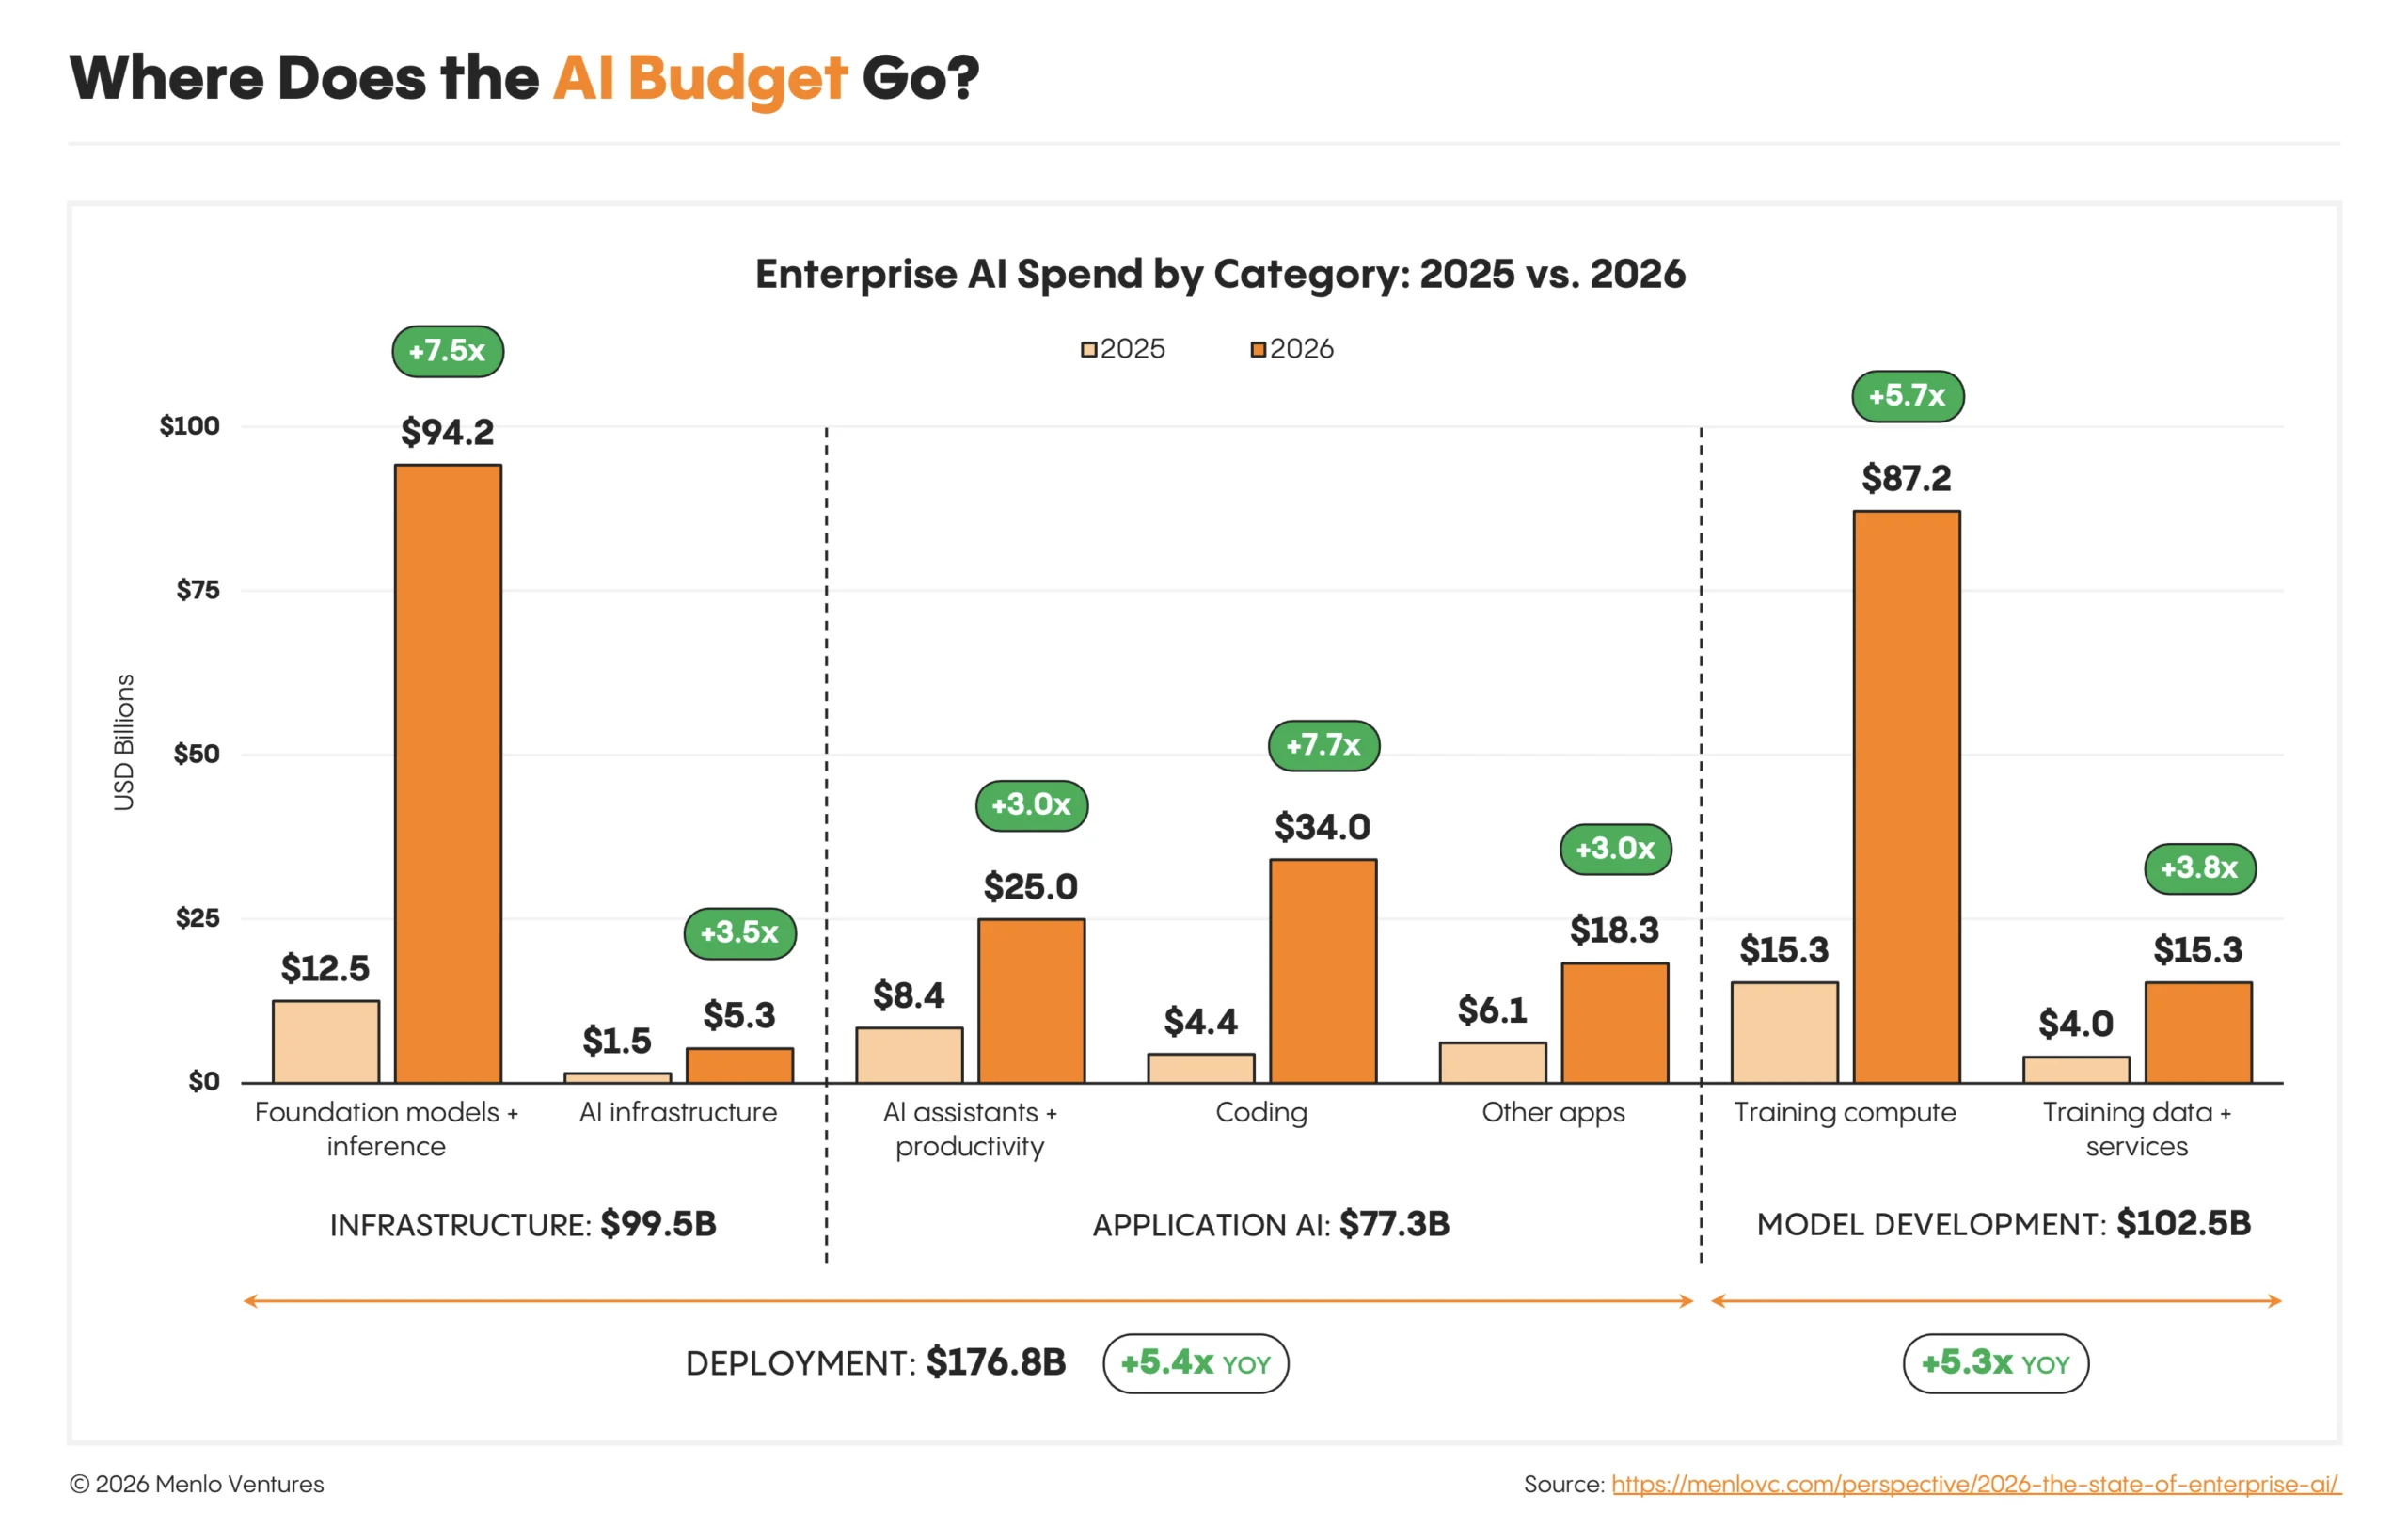
For every $1 the industry spends building AI models, enterprises spend about $1.70 putting them to work. As of September 2026, we estimate $176.8B in enterprise spending on using AI (up 5.4x) versus $102.5B on building models (up 5.3x).
That demand underwrites the buildout. We estimate that Anthropic and OpenAI alone account for 25%+ of AWS, Azure, and Google Cloud revenue, with much of that spend going to training. That investment only pays off if enterprises keep putting models to work, which agents are now driving.
Deployment (using AI) – $176.8B:
- Infrastructure ($99.5B): The stack that runs models and the agents built on them, from frontier model inference (Anthropic, OpenAI, Google) and inference platforms (Fireworks*, Baseten, Modal*, Gimlet*) to agent infrastructure (Databricks*, Temporal*).
- Applications ($77.3B): AI products enterprises use, including coding ($34.0B; Claude Code, Codex) and workplace assistants ($25.0B; Microsoft Copilot).
Development (building AI) – $102.5B:
- Training compute ($87.2B): The compute that trains models, from hyperscalers (AWS, Azure, Google Cloud) to specialized clouds (CoreWeave, Together).
- Training data and services ($15.3B): The inputs for training models, including expert data and evaluations (Mercor*) and reinforcement-learning environments (Fleet*).
Part II. Model Usage
Buyers Keep Paying Up for the Frontier
Open-source usage is rising and, in recent weeks, Anthropic and OpenAI have started discounting even their flagship models. The result is sharper competition at every intelligence tier, but our data show buyers continue to prioritize capability over cost in model selection.
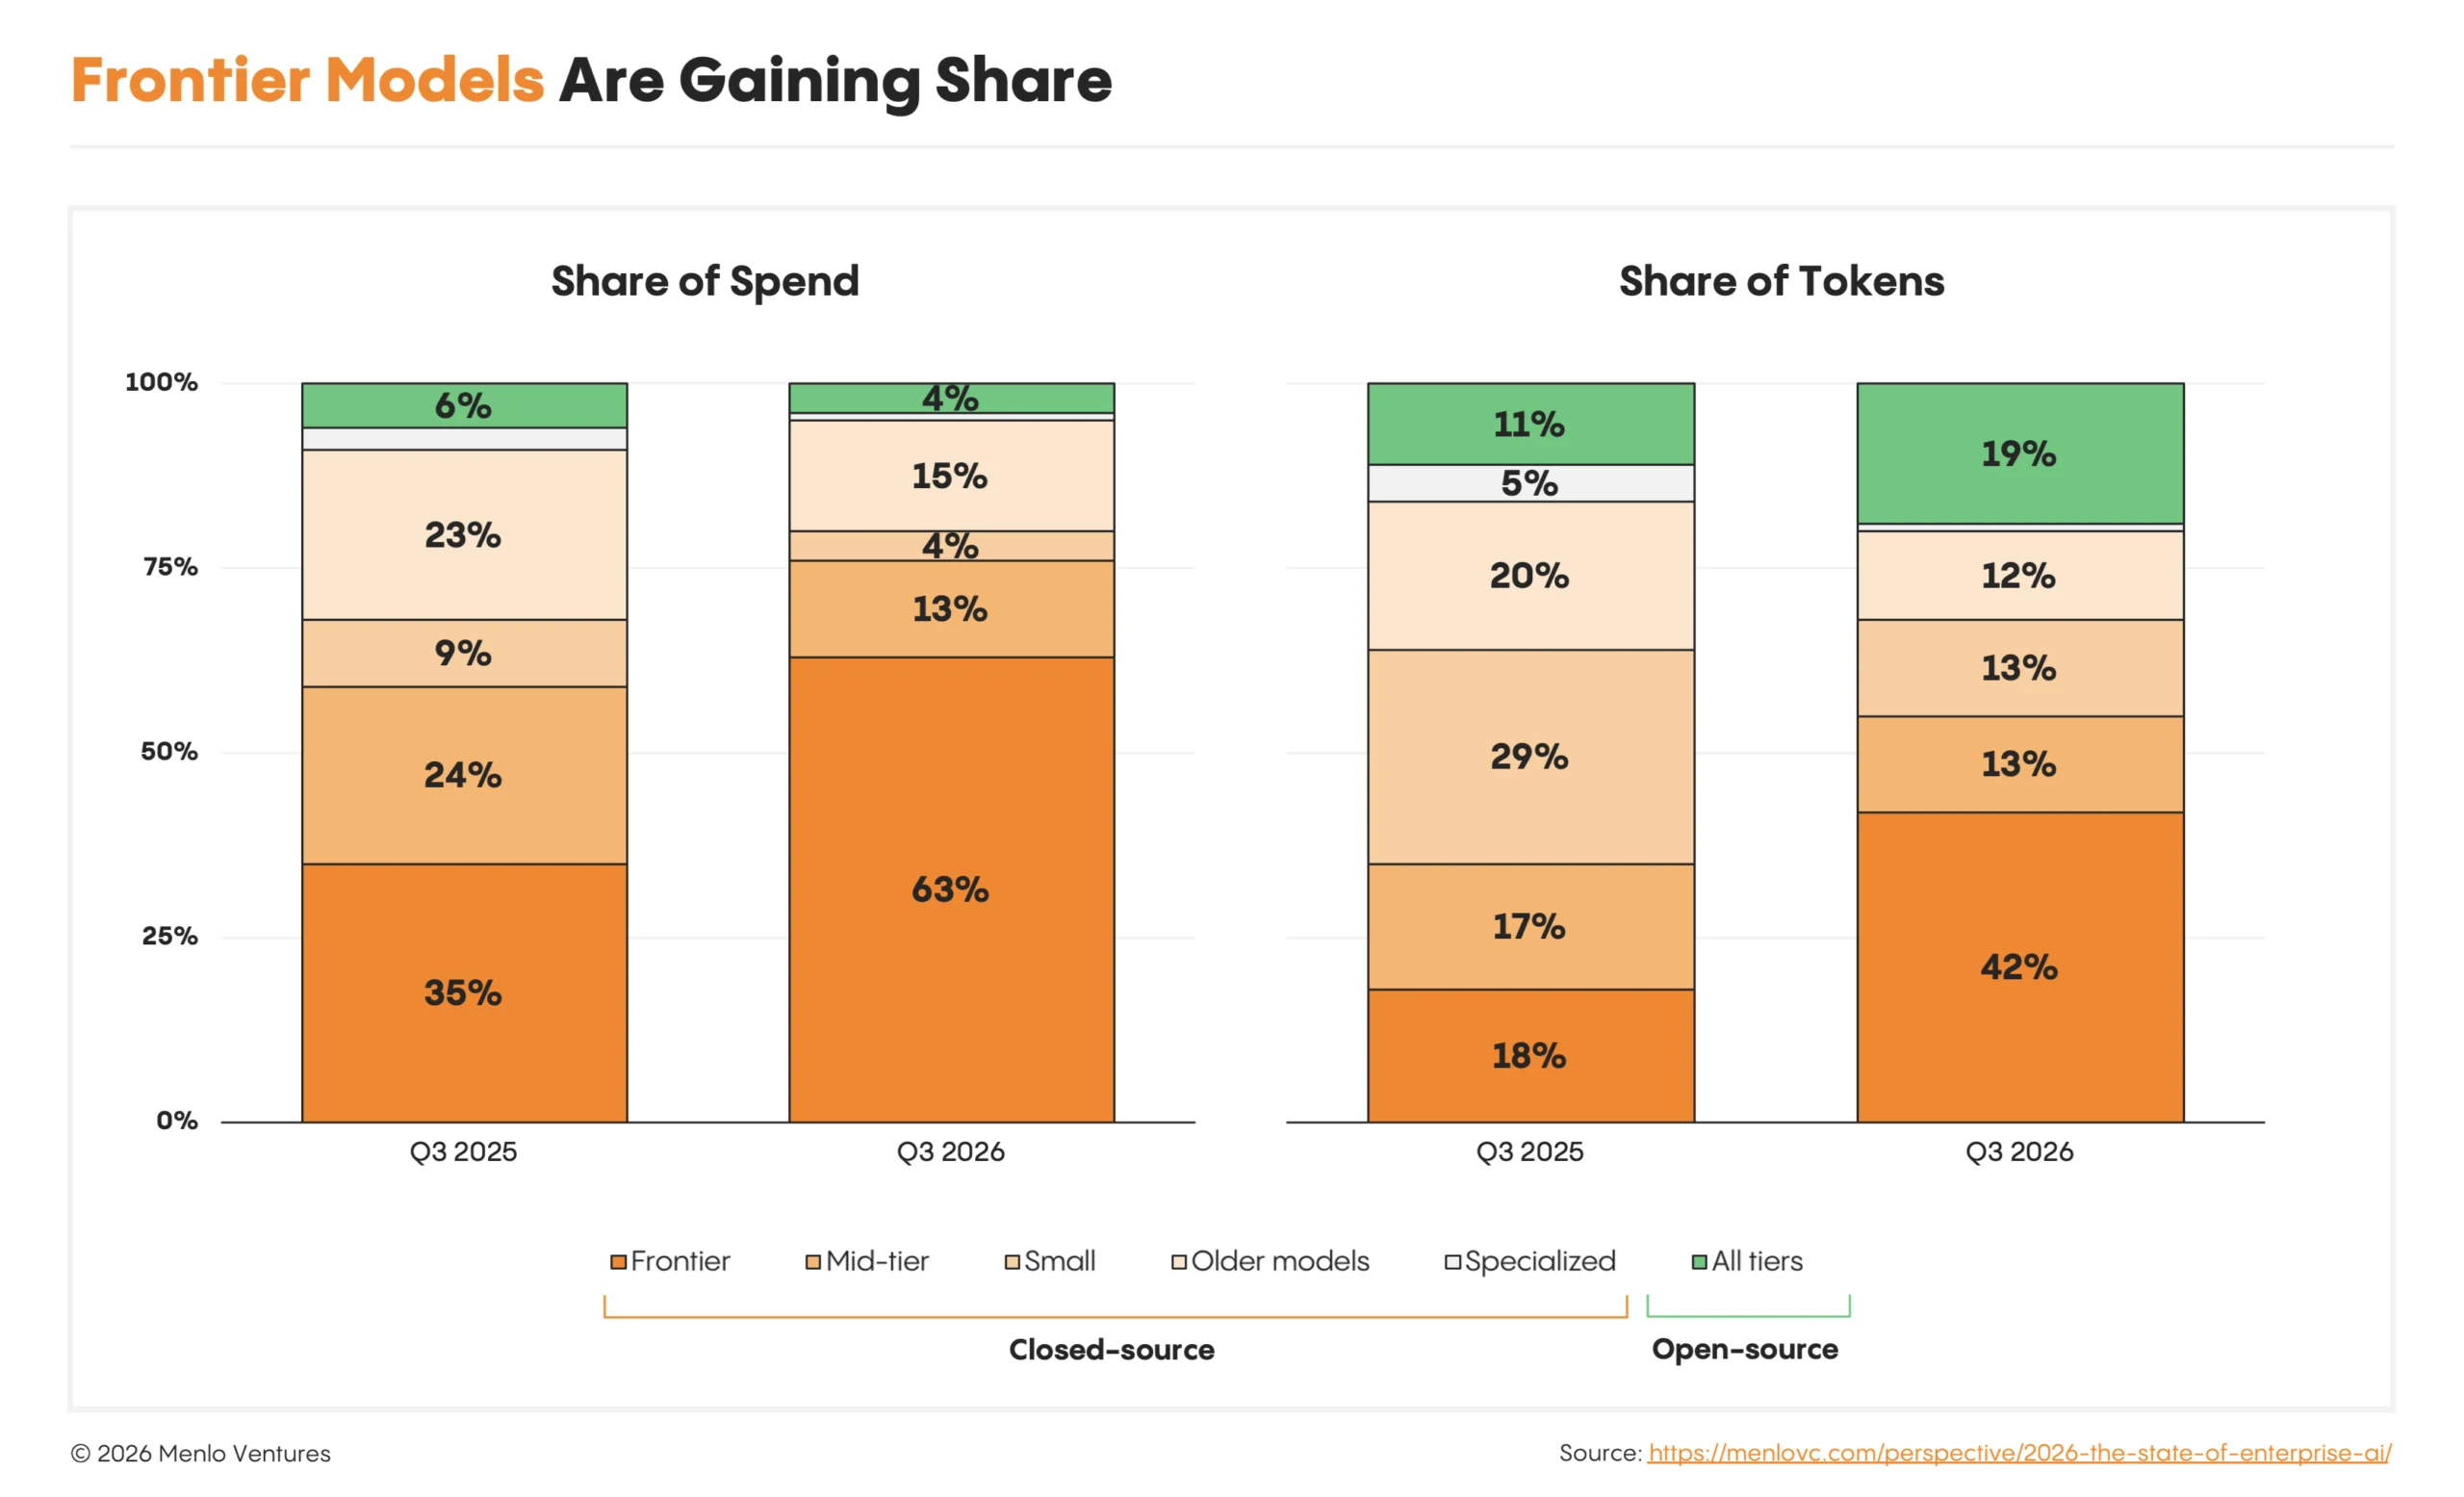
- Frontier models are gaining share. Frontier models more than doubled their share of tokens, from 18% to 42%, outpacing even open-source growth. Their share of spending also climbed, from 35% to 63%.
- Buyers are trading up from less expensive models. A year ago, the most popular models were Claude Sonnet 4.5 ($3 per million input tokens/$15 per million output tokens) and GPT-5 ($1.25/$10). Today, they are Claude Opus 5.5 ($4/$20) and GPT-6 Astra ($10/$60). The mix shift has kept most of the value with the most capable models, even as individual model families are discounted.
- The price war is at the low end. Frontier labs have cut small-model prices by 80% or more, yet small closed models like Haiku and Luna still saw their share of tokens fall from 29% to 13% as open-source competes for those workloads.
Open-Source Is Taking Off in Usage but Not Spend—Yet
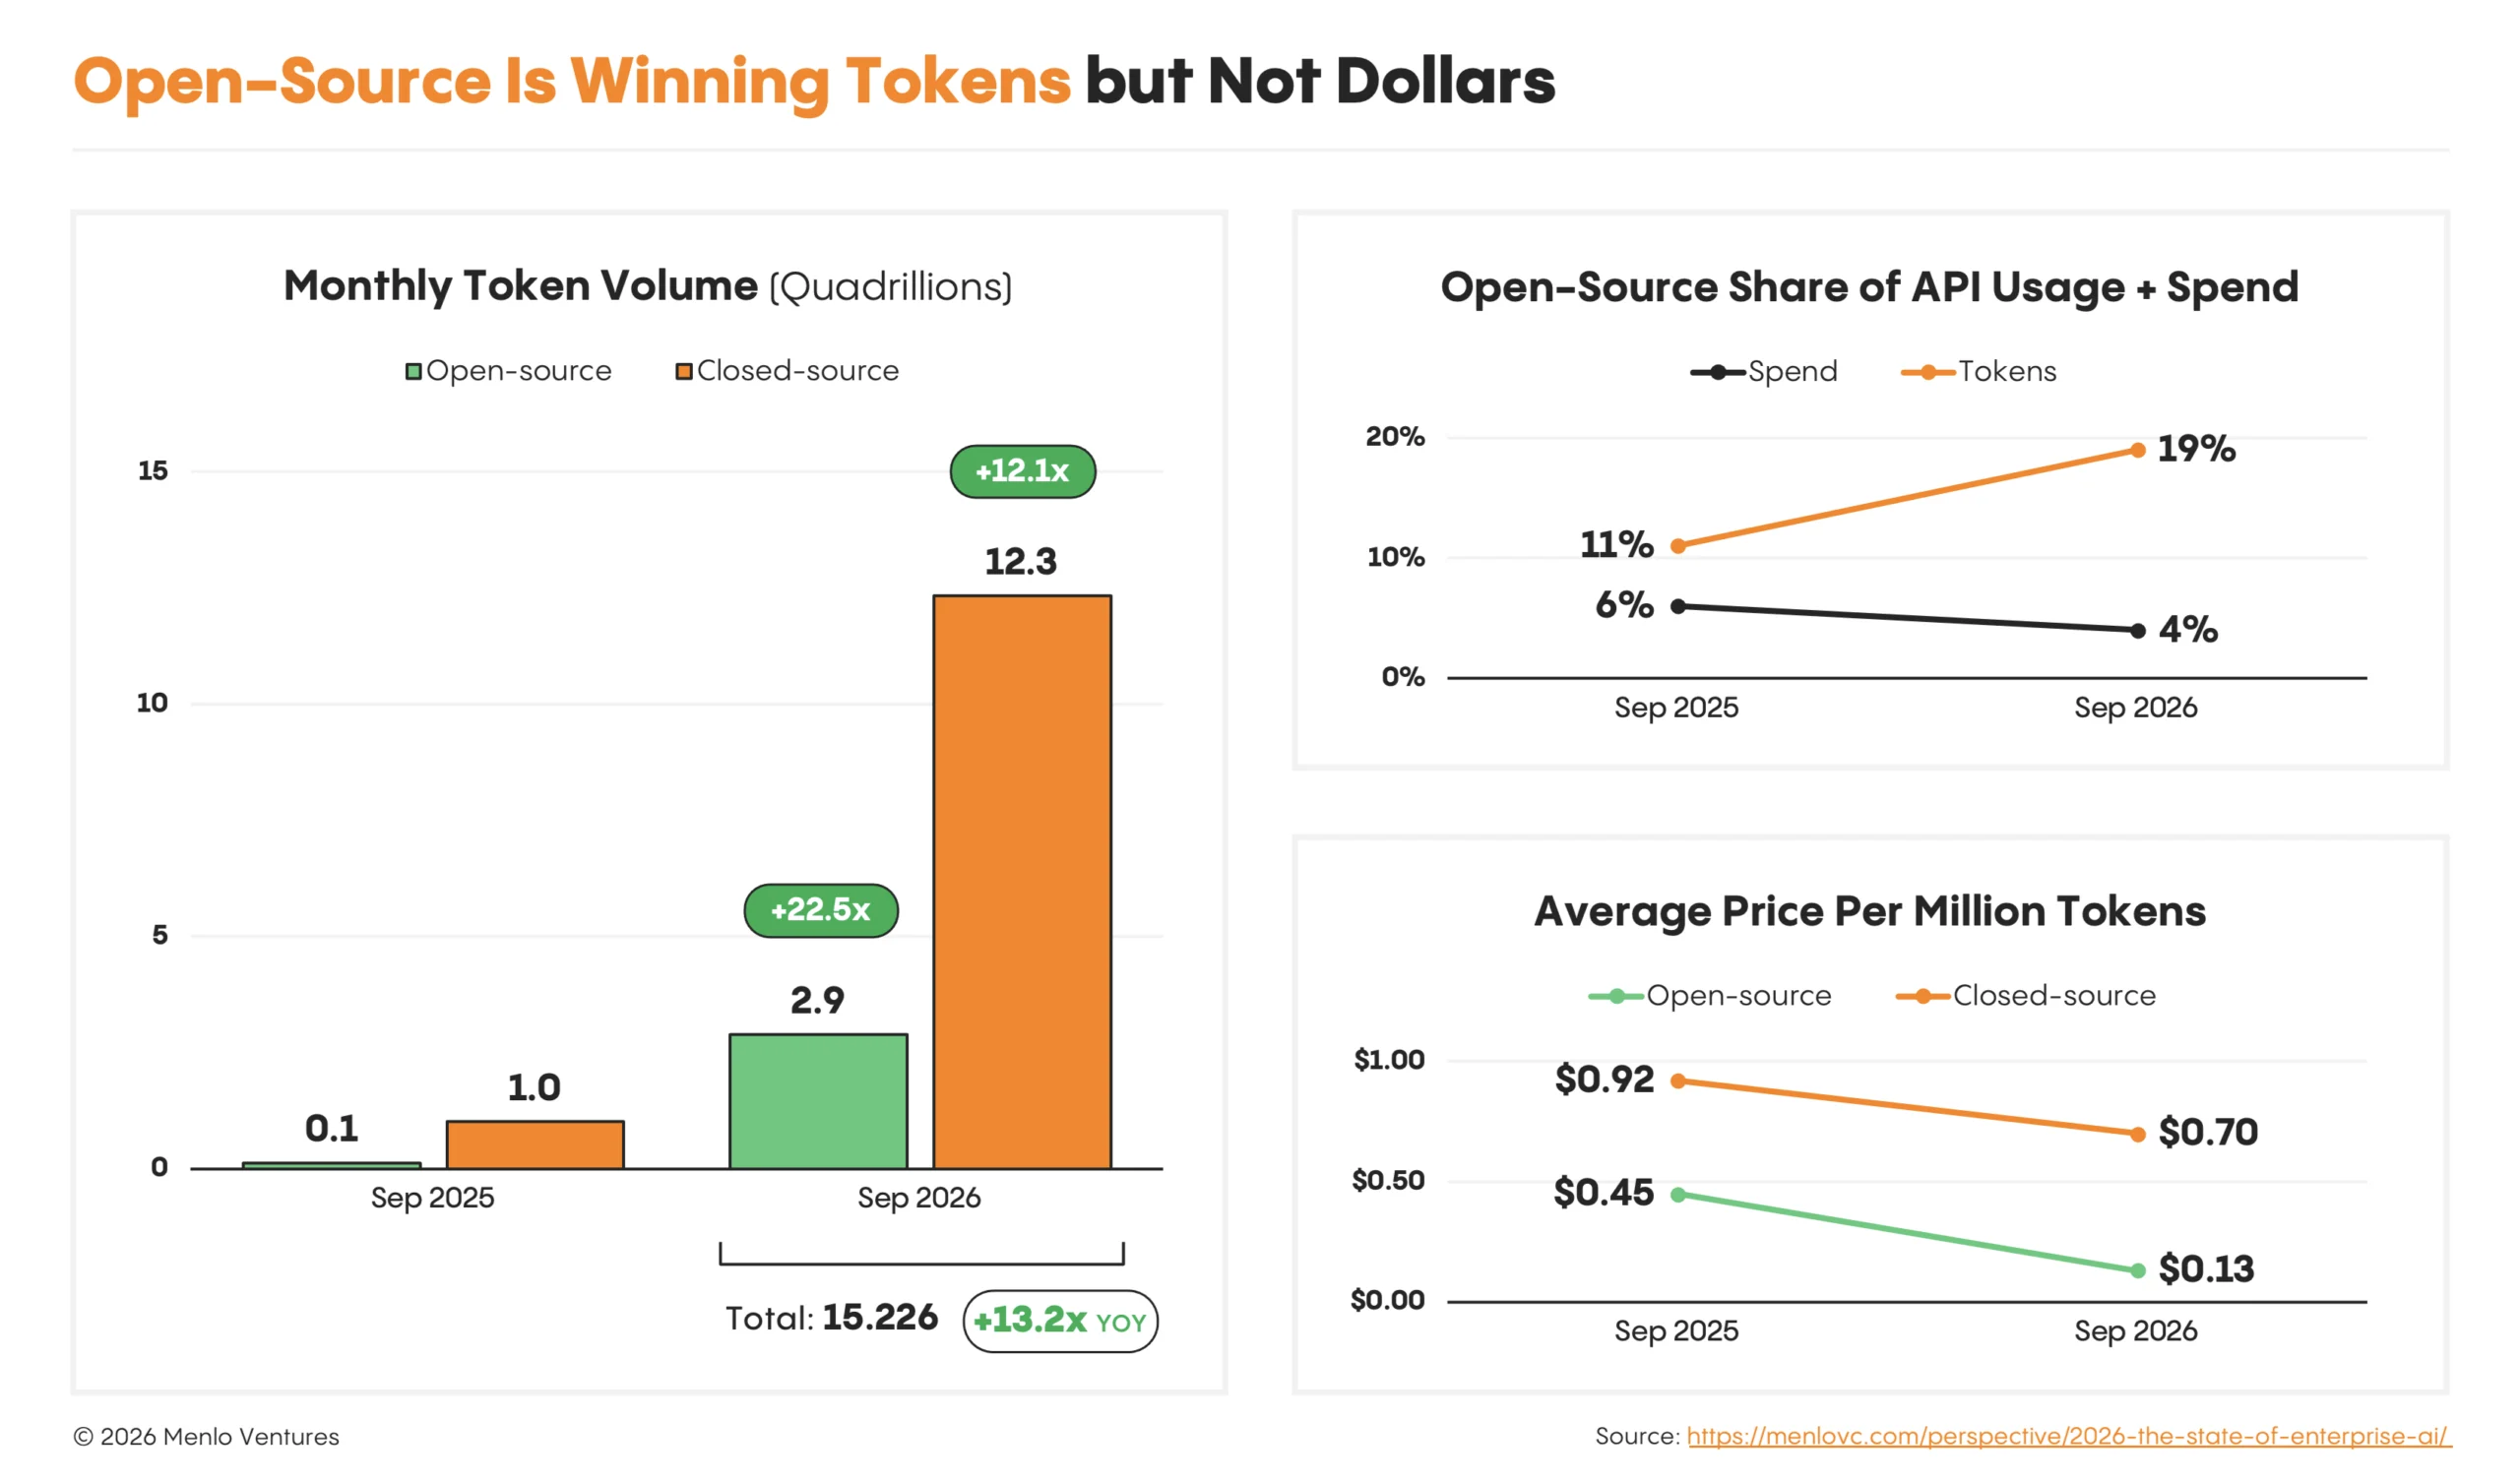
Open-source now handles about one in five tokens but accounts for only about one in 25 dollars of model spending, driven by a significant delta in price between closed and open-source models.
Four key trends:
- Volume is up sharply. Open-source volume is up 22.5x to an estimated 2.9 quadrillion tokens per month, comfortably outpacing closed-source token growth of 12.1x. Much of it runs on inference clouds like Fireworks and Modal, both of which passed $1 billion in revenue run rate this year.
- But prices fell even faster. The average open-source token fell 3.3x in price to $0.13 per million, while the blended price of closed-model tokens fell 24% to $0.70. As a result, open-source’s share of spend drifted down from 6% to 4%, even as its share of tokens nearly doubled.
- Chinese models dominate open-source spend. As their capabilities have defined the open-source frontier, Chinese models grew to 89% of open-source spend, led by Kimi (61%), DeepSeek (15%), GLM (11%), and Qwen (3%). Meta’s Llama is the most popular Western open-source model at 7%.
- Agents pull blended prices down, too. Cache reads can make up 95% or more of an agent’s tokens, and they’re cheap: Opus 5.5 charges $0.20 per million for them, vs. $4 for fresh input and $20 for output. At a mix of 3% fresh input and 2% output, an agent session costs about $0.70 per million tokens. As agents account for more of the usage, the average price per token falls.
Post-Training Is Still Early (and Hard), but an Ecosystem Is Emerging
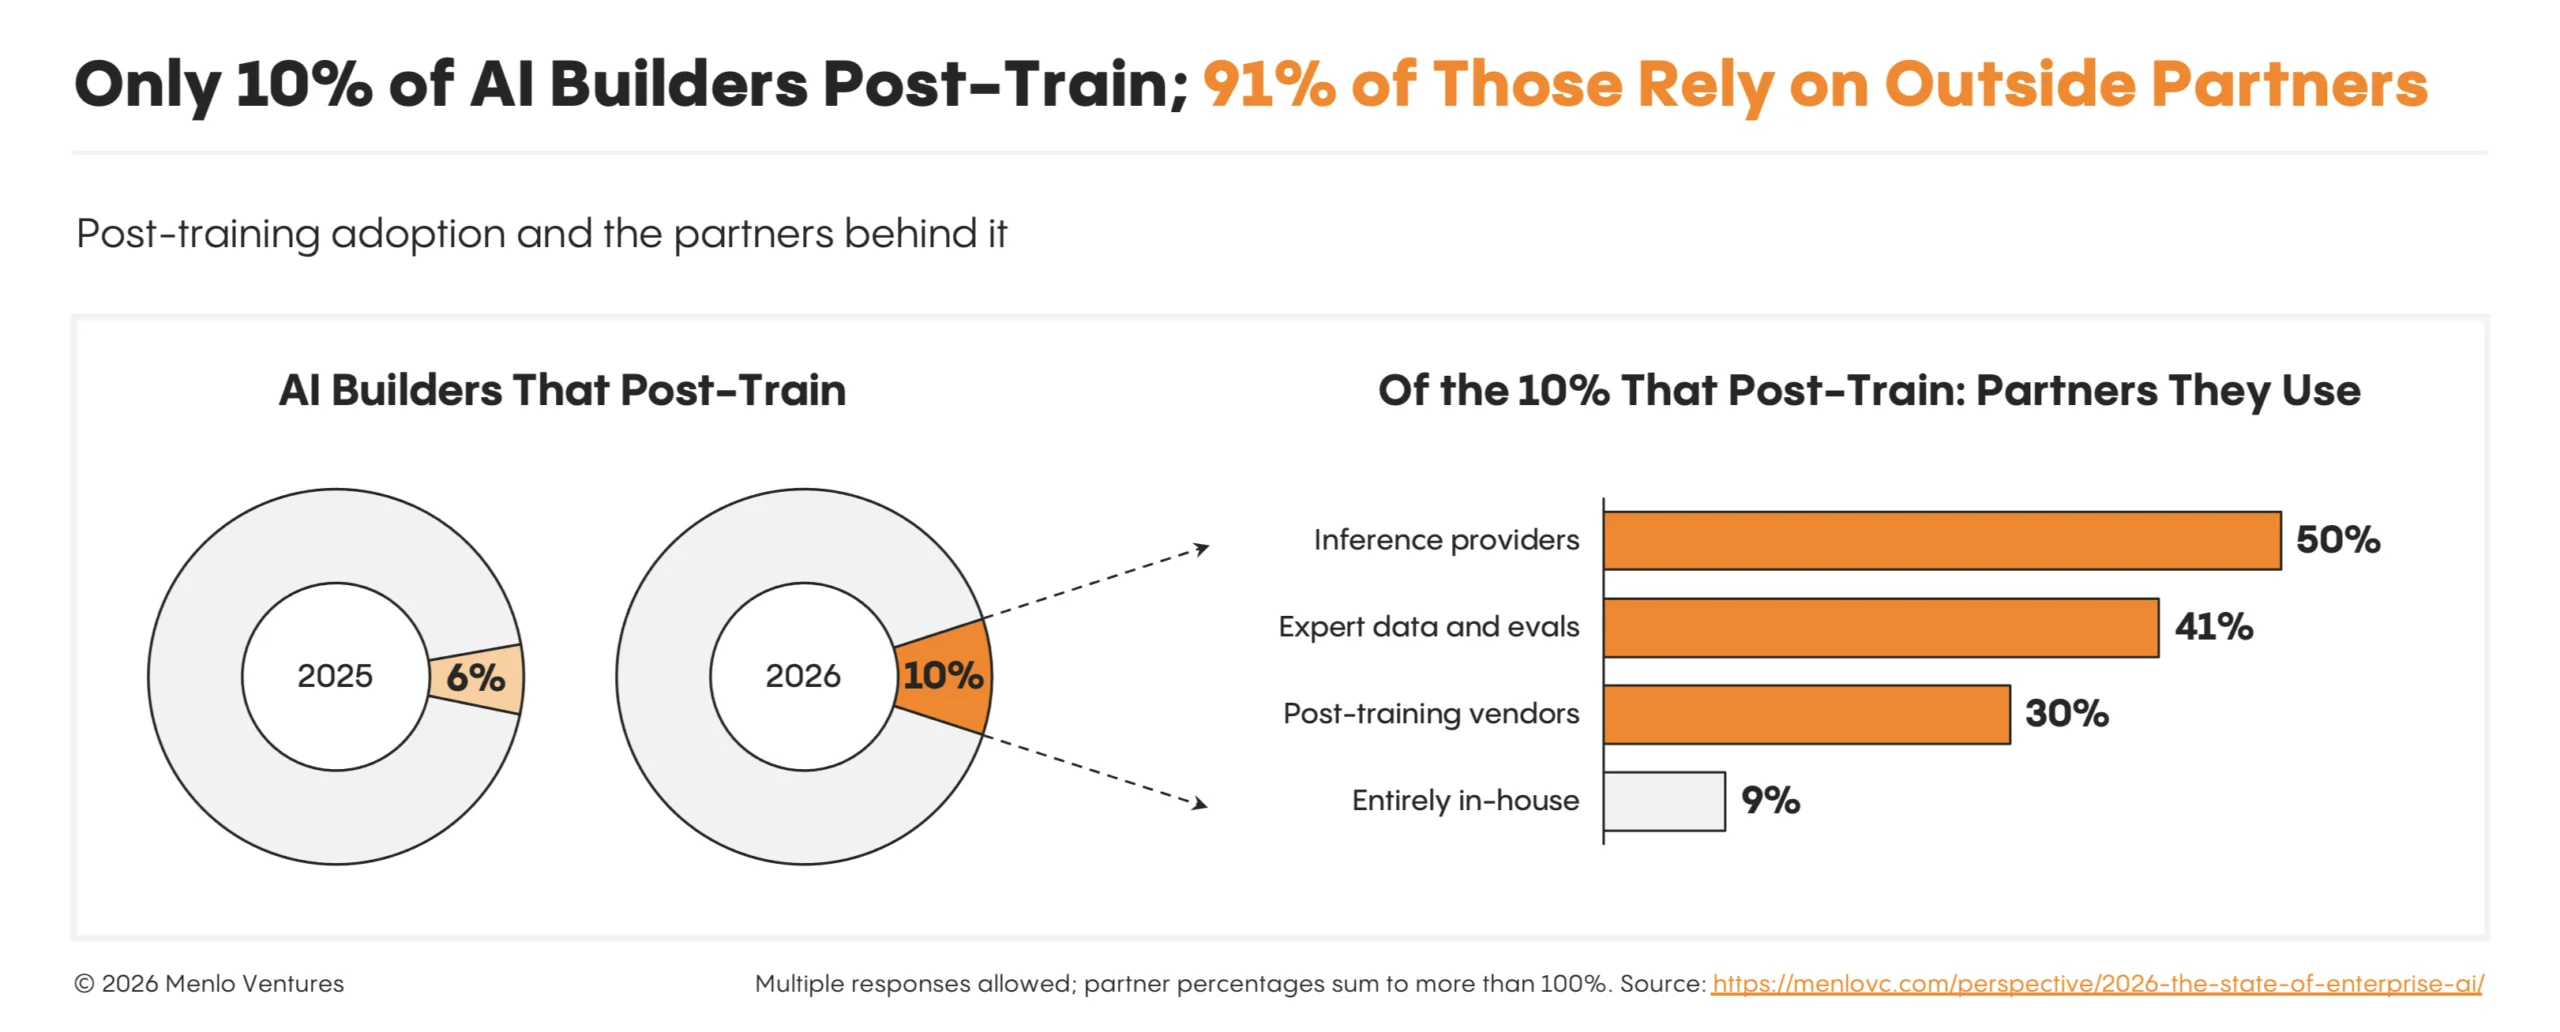
Open weights give builders something closed models largely can’t: control over the model itself. Post-training lets them specialize models for their own tasks to lower costs and reduce dependence on frontier labs. Adoption rose from 6% of AI builders in 2025 to 10% this year, but it remains limited.
Two things hold it back: specialized models need constant updates to keep pace with a frontier that moves every few months, and most application companies lack the expertise to train them effectively. That creates an opportunity for infrastructure and services providers. Among builders that post-train, 91% use outside partners, including:
- 50% use infrastructure providers like Fireworks and Modal
- 41% use expert-data and evaluation platforms like Mercor
- 30% use specialists like Applied Compute, Trajectory, and Noeri*
Cursor* built Composer 2 on Kimi K2.5, with Fireworks providing inference infrastructure for reinforcement-learning rollouts. Harvey developed Tenet with Fireworks and Mercor, and separately partnered with Applied Compute on its Review Table model.
Part III. Agents in Production
AI Spend Concentrates Where Agents Work Best
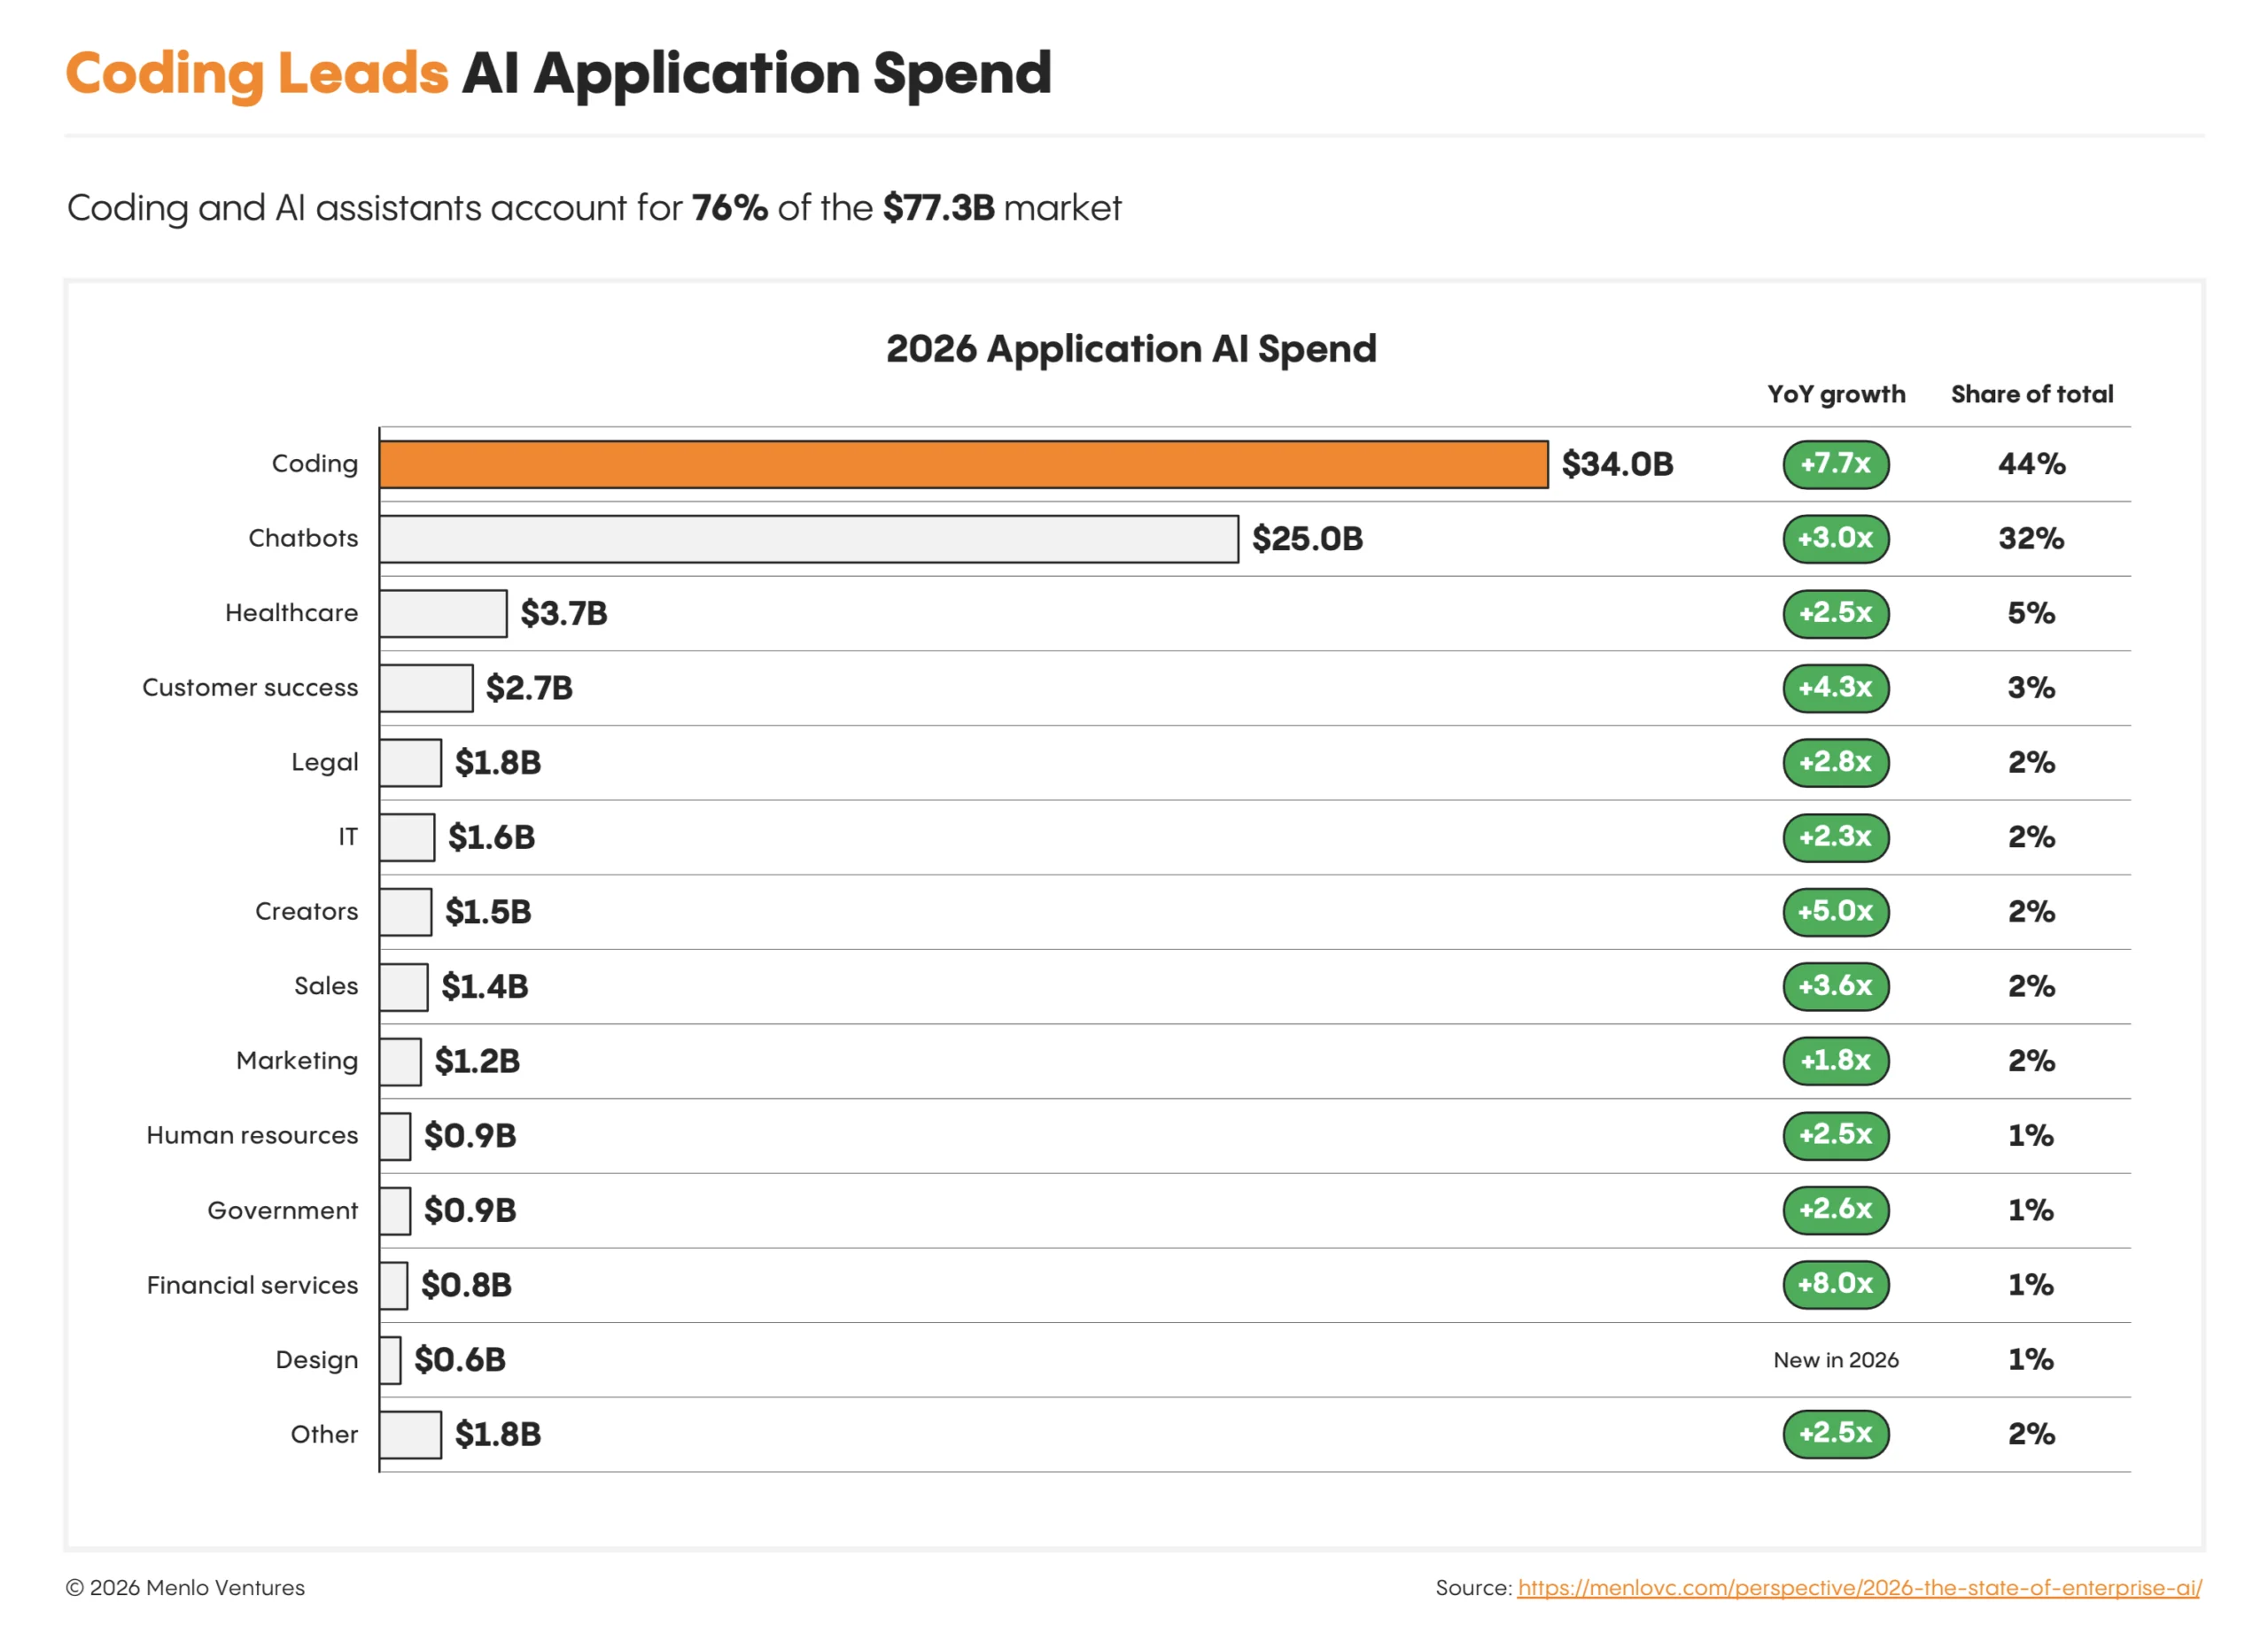
The total AI application market is now $77.3B, up from $19B last year. But just two markets account for 76% of all app spend: coding ($34.0B, up 7.7x) and enterprise chatbots ($25.0B, up 3.0x). To put that in perspective, healthcare—one of the world’s largest industries—ranks a distant third at just $3.7B.
Agents have driven much of the growth in these two markets, as both provide key conditions that help agents succeed:
- Environments in which agents can act. Agents need connections to the systems where work happens so they can retrieve context and take action. Code repositories and connected apps like email, Slack, and drive provide that access.
- Complete context agents can learn from. Agents need both the tacit knowledge behind a request (its intent, assumptions, and organization-specific conventions) as well as the procedural knowledge for how work usually gets done. Code, documentation, and worked examples make both accessible.
- Results agents can verify. Clear success criteria help models learn during training and agents assess progress and correct mistakes in production. Coding is especially strong in this regard: compilers check whether code builds, and tests check whether it behaves as expected. Common enterprise agent tasks like knowledge retrieval are also relatively easy to verify.
Where these conditions hold, spend follows. Customer success, where support playbooks document the steps and resolutions define success, grew 4.3x to $2.7B. Where they are harder to meet, growth is less robust. Human resources, where work often involves more subjective judgment, grew slower (2.5x), at smaller scale, to $0.9B. Marketing similarly grew just 1.8x to $1.2B.
Coding: AI Labs Lead, but Are Catalyzing a Massive App Ecosystem
As AI’s first killer use case, software development previews how agents can transform an entire category. The impact is now visible at ecosystem scale: Enterprise code activity is up 5x year over year, and that doesn’t include vibe coding, where Lovable* alone adds more repos in a month (+32M) than all of GitHub (+24M).
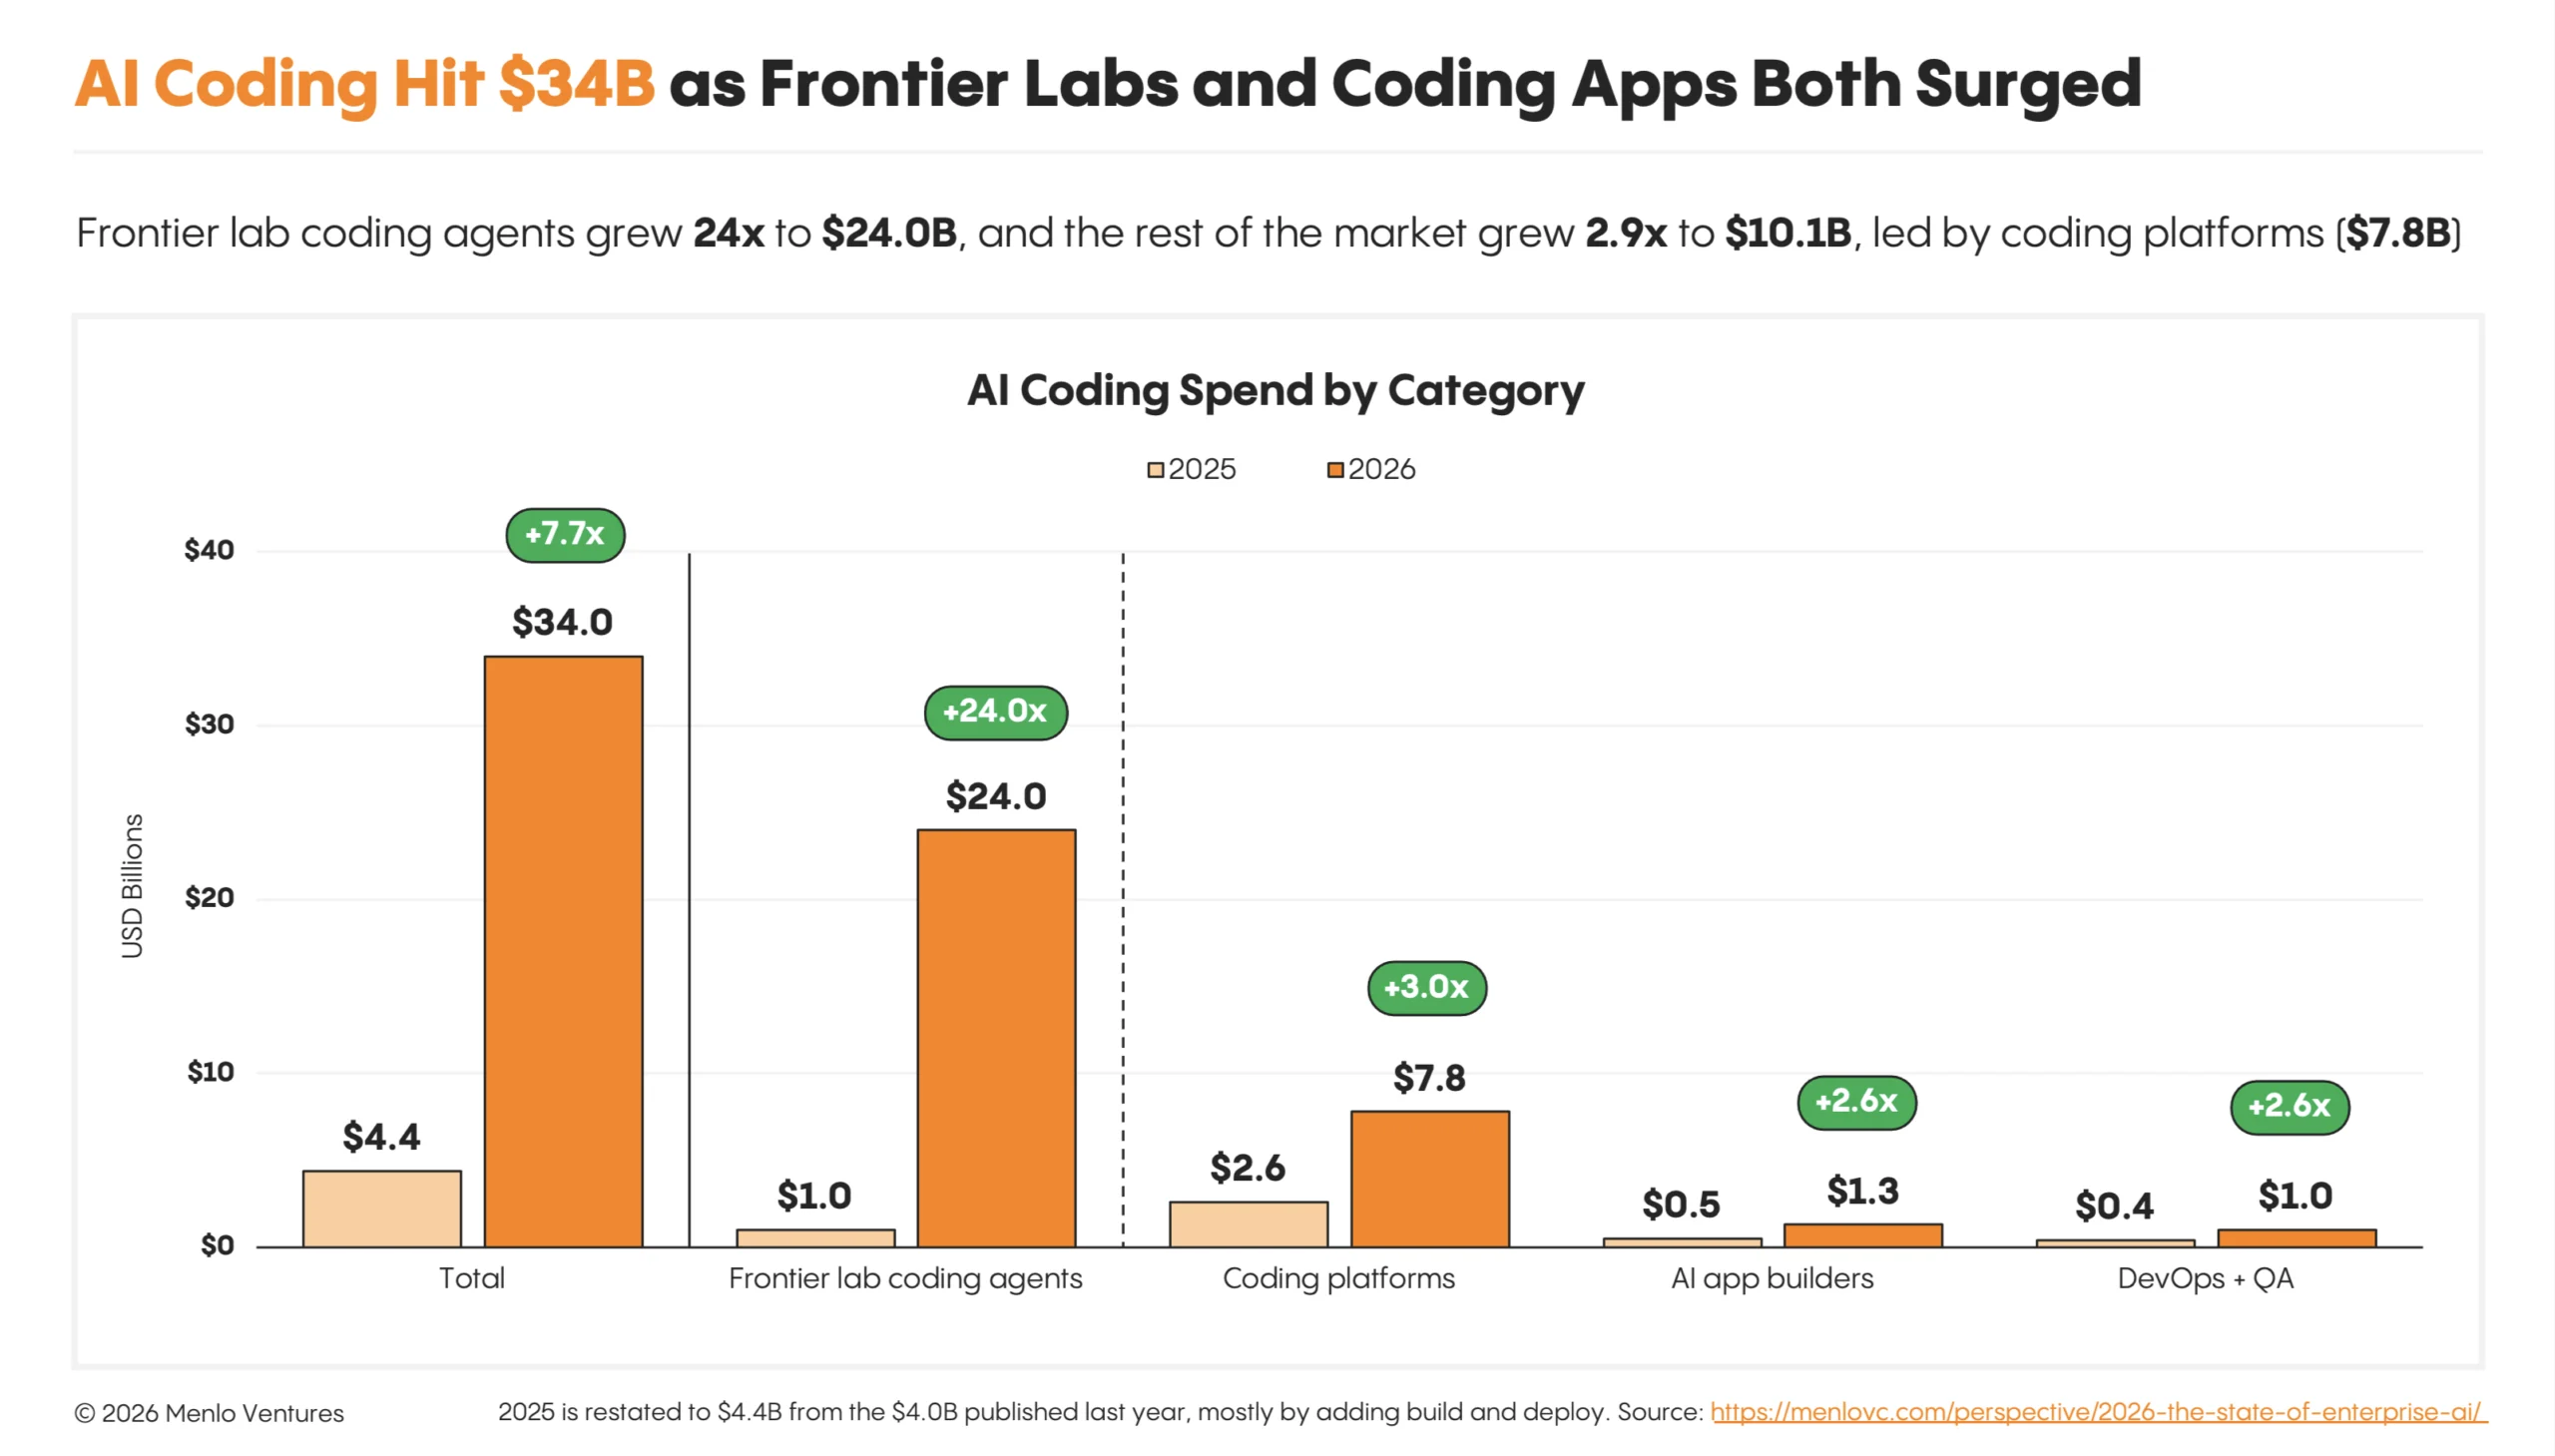
The labs capture most of the spend. Anthropic’s Claude Code and OpenAI’s Codex combine for $24.0B, 70% of the $34.0B coding market, up from about $1B last year.
But independent companies are growing, too. The rest of the market grew 2.9x to $10.1B, led by coding platforms like Cursor, Cognition, and Factory, as well as AI app builders like Lovable. More code is also creating demand for the tools that review, deploy, and maintain it: Pierre and East River Source Control in code storage, Greptile* in code review, Harness* and Blacksmith in build and deploy, and Resolve in SRE.
Horizontal Apps: AI Is Proliferating Well Beyond Coding
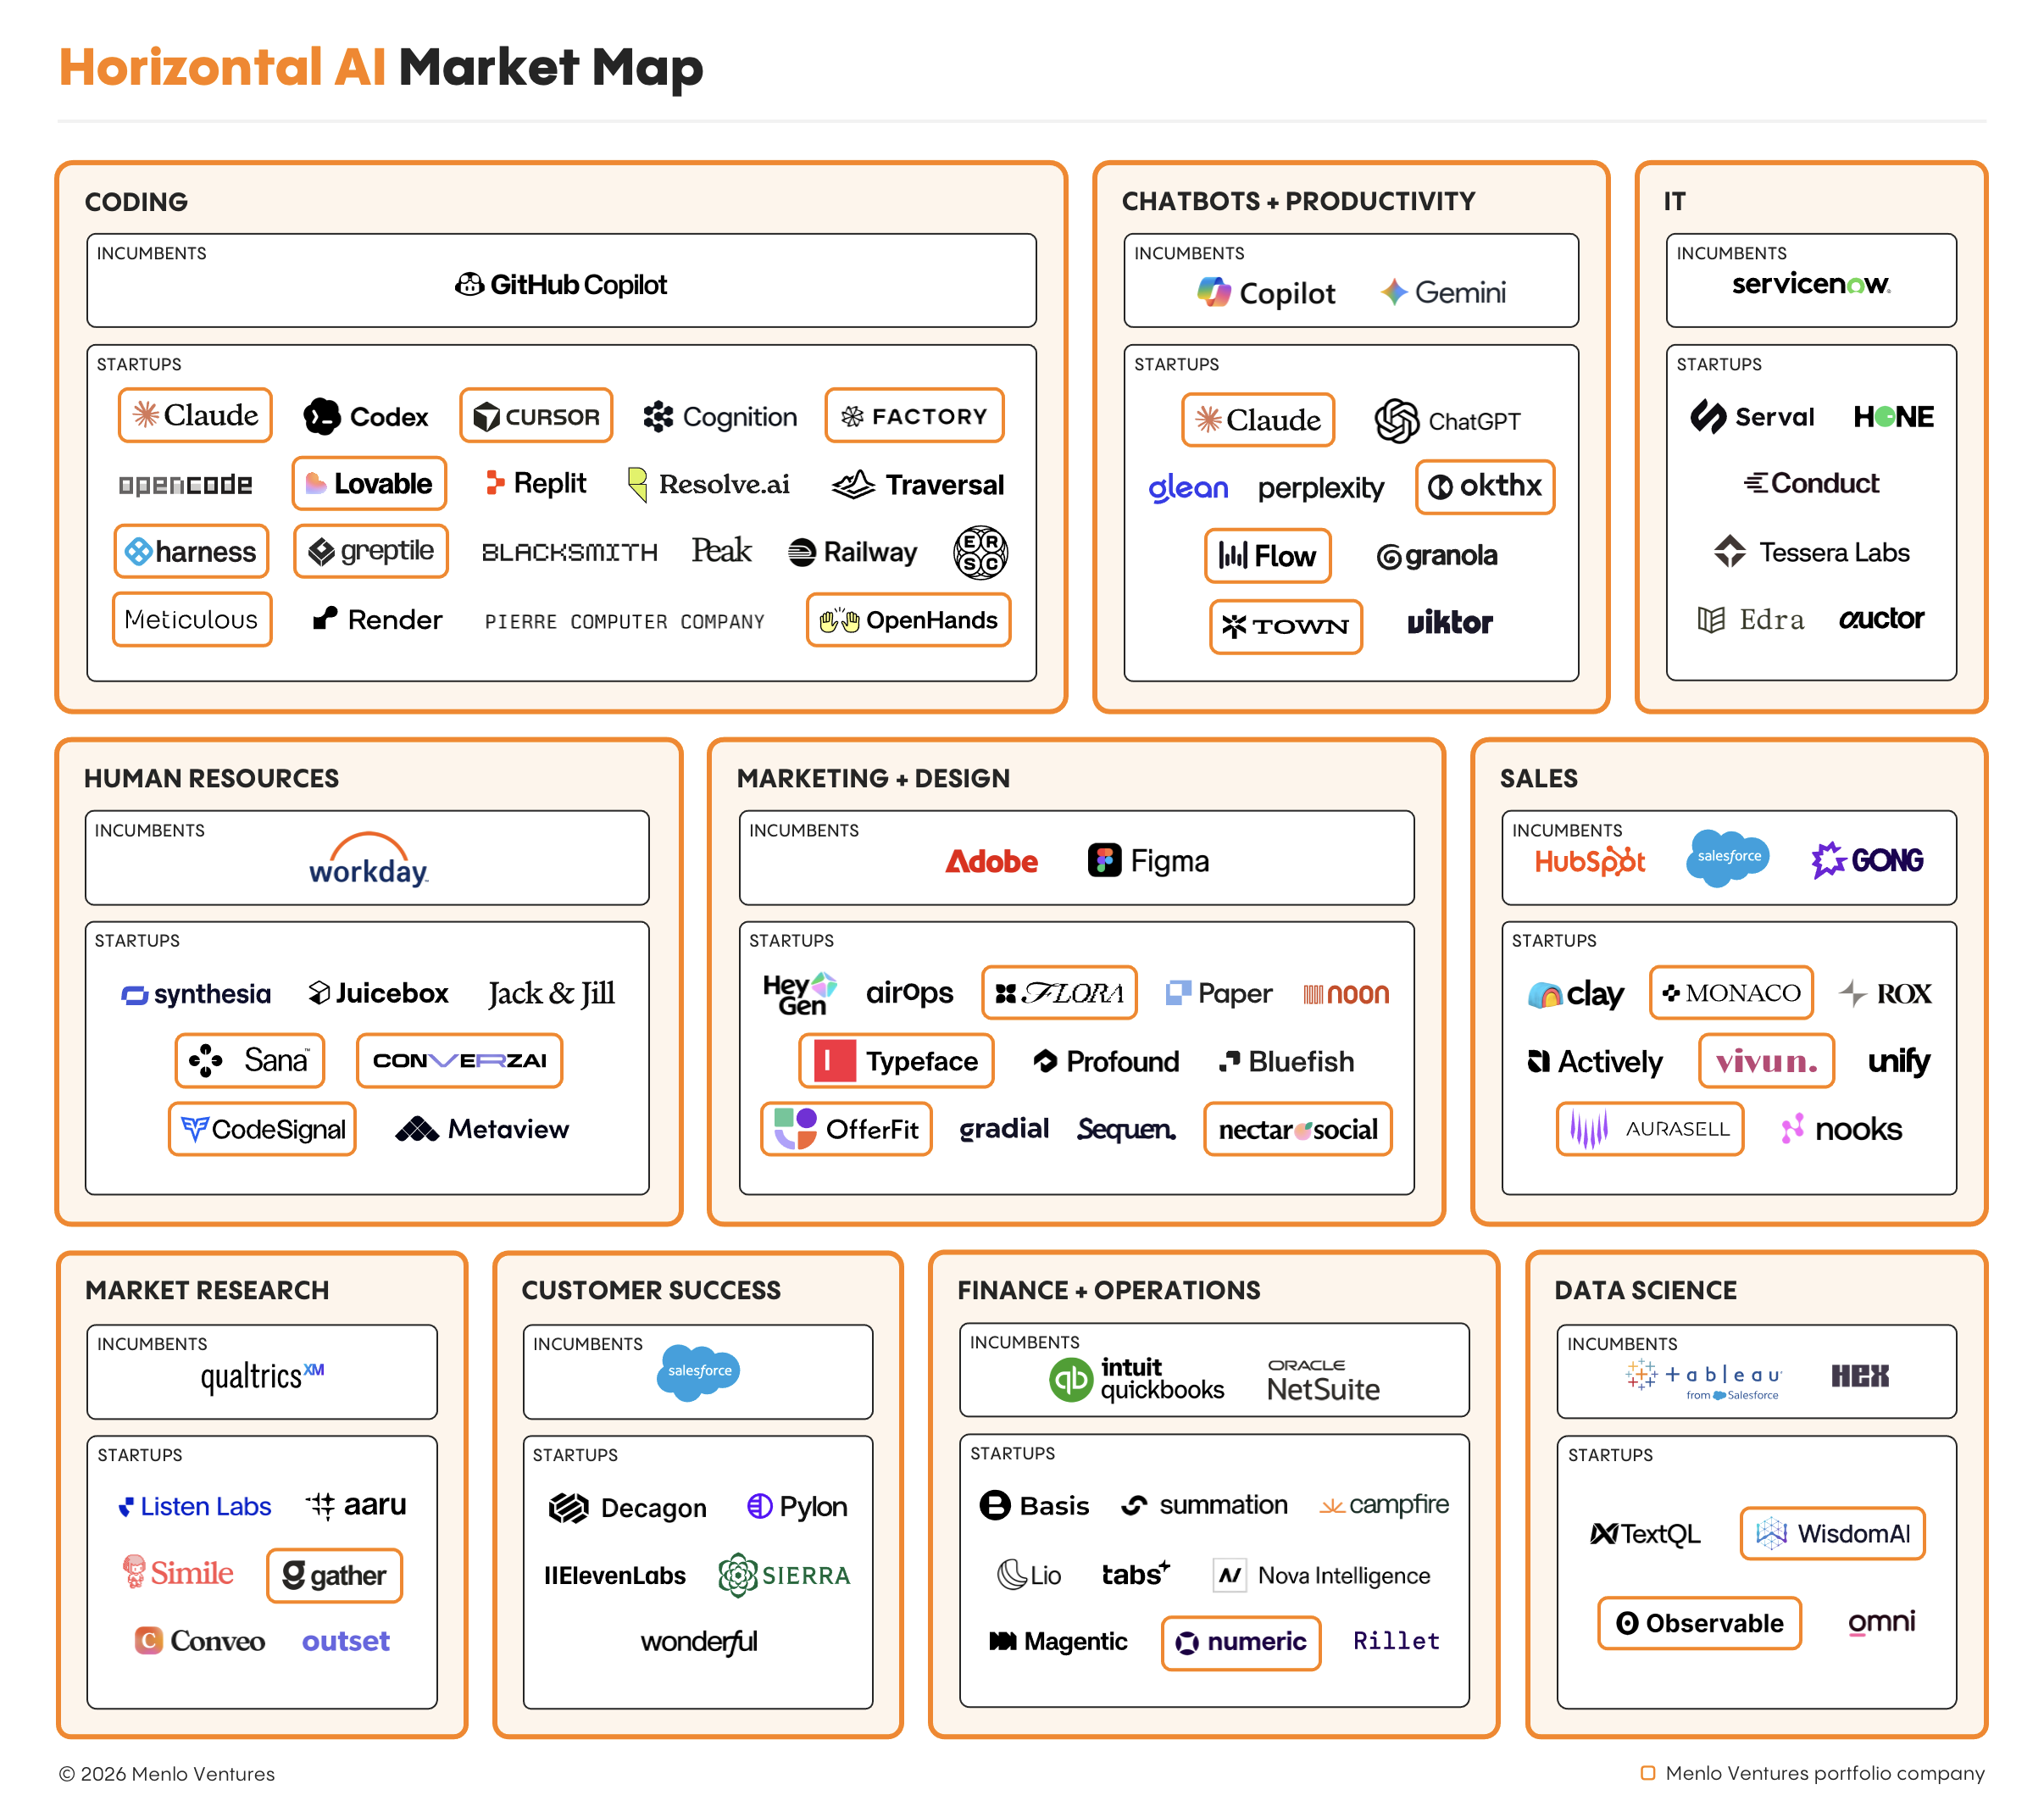
Horizontal apps serve a function or the whole workforce rather than a single industry. Outside coding and chatbots, they combine for $8.8B (up 3.0x). The fastest growth is in functions that look most like coding—with connected systems in which agents can act, complete context for how work gets done, and verifiable outcomes.
Most enterprise markets lack these conditions, so the opportunity for the app layer is to create them for new domains. That means connecting agents to all the fragmented systems and context they need, making tacit knowledge and procedures accessible, and designing evals to help agents to improve.
Some of the standouts doing this work include:
- Sierra and Decagon (customer support, $2.7B market, up 4.3x) build agents that resolve customer issues end to end across chat, email, and voice—embedding forward-deployed engineers or agent PMs to design procedures, connect systems, and codify workflows.
- Serval (IT, $1.6B, up 2.3x) similarly stands up automations for the IT help desk, handling access requests, provisioning, and troubleshooting. Hone turns past work into simulations, creating a testing ground where teams can evaluate and improve agents before deployment.
- Clay and Monaco* (sales, $1.4B, up 3.6x) cover two sides of the sales stack. Clay uses web agents to research prospects and enrich accounts. Monaco is an AI-native CRM that updates itself, so reps sell instead of entering data.
Vertical Apps: Healthcare and Legal Lead
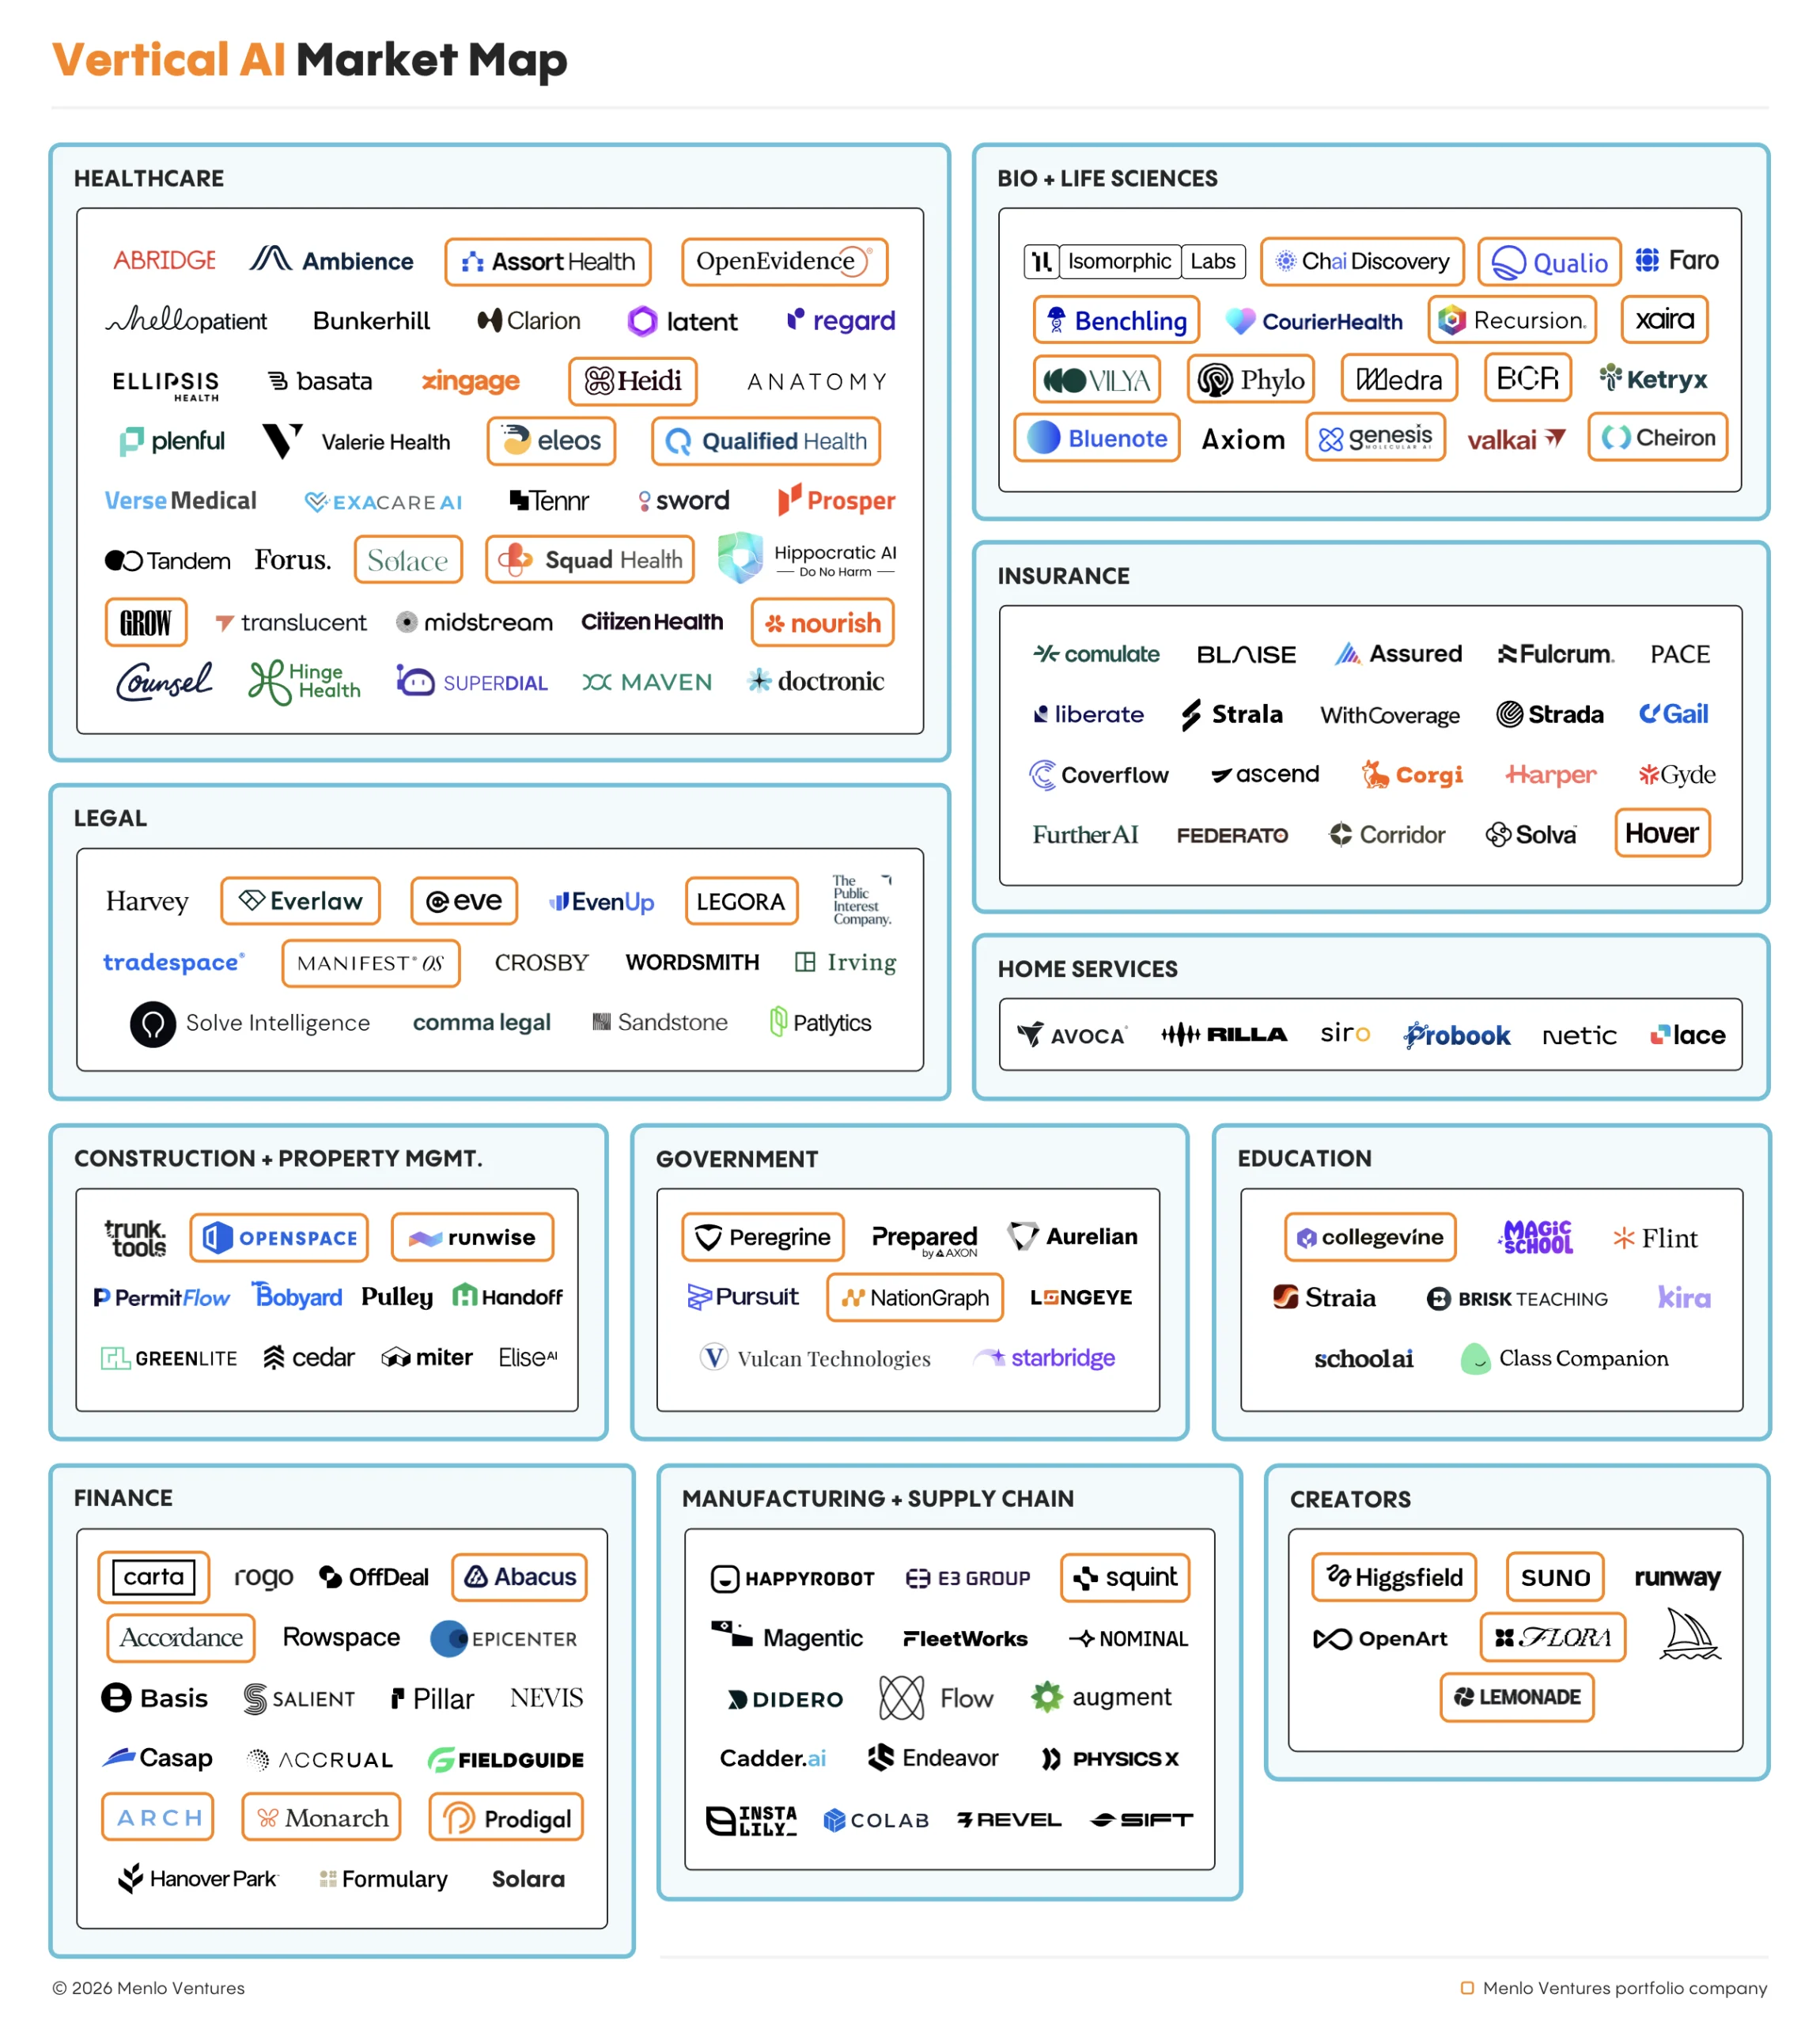
Vertical apps are built for a single industry. Vertical AI is a $10.1B market, up 2.9x from $3.5B last year.
Healthcare ($3.7B, up 2.5x) still leads every industry category with 37% of vertical spend, and on its own, it’s now bigger than all of vertical AI was last year. Clinical tools drove the growth, led by OpenEvidence* at the point of care and ambient scribes like Abridge. This year, biology emerged the next frontier, as Anthropic, OpenAI, Isomorphic Labs and Chai Discovery* invested heavily in AI for research and drug discovery.
Legal ($1.8B) is second, up 2.8x. Harvey and Legora continue to compound as their products moved from drafting help to agents that handle entire workflows, from due diligence to contract review. AI is reaching plaintiff firms too, with platforms like Eve* automating demand letters and case preparation.
AI-Natives Are Winning the Agent Categories
Distribution wins when AI enhances an existing workflow; capability wins when AI redefines it. Incumbents hold the departments where AI has to fit inside a system of record, while AI-natives are winning where agents are rewriting the work itself.
Overall, AI-native providers now capture 77% of application-layer spend and 90% of infrastructure-layer spend, up from 63% and 44% last year. The lead isn’t just the frontier labs either; excluding them, startups still take 61% of application spend.
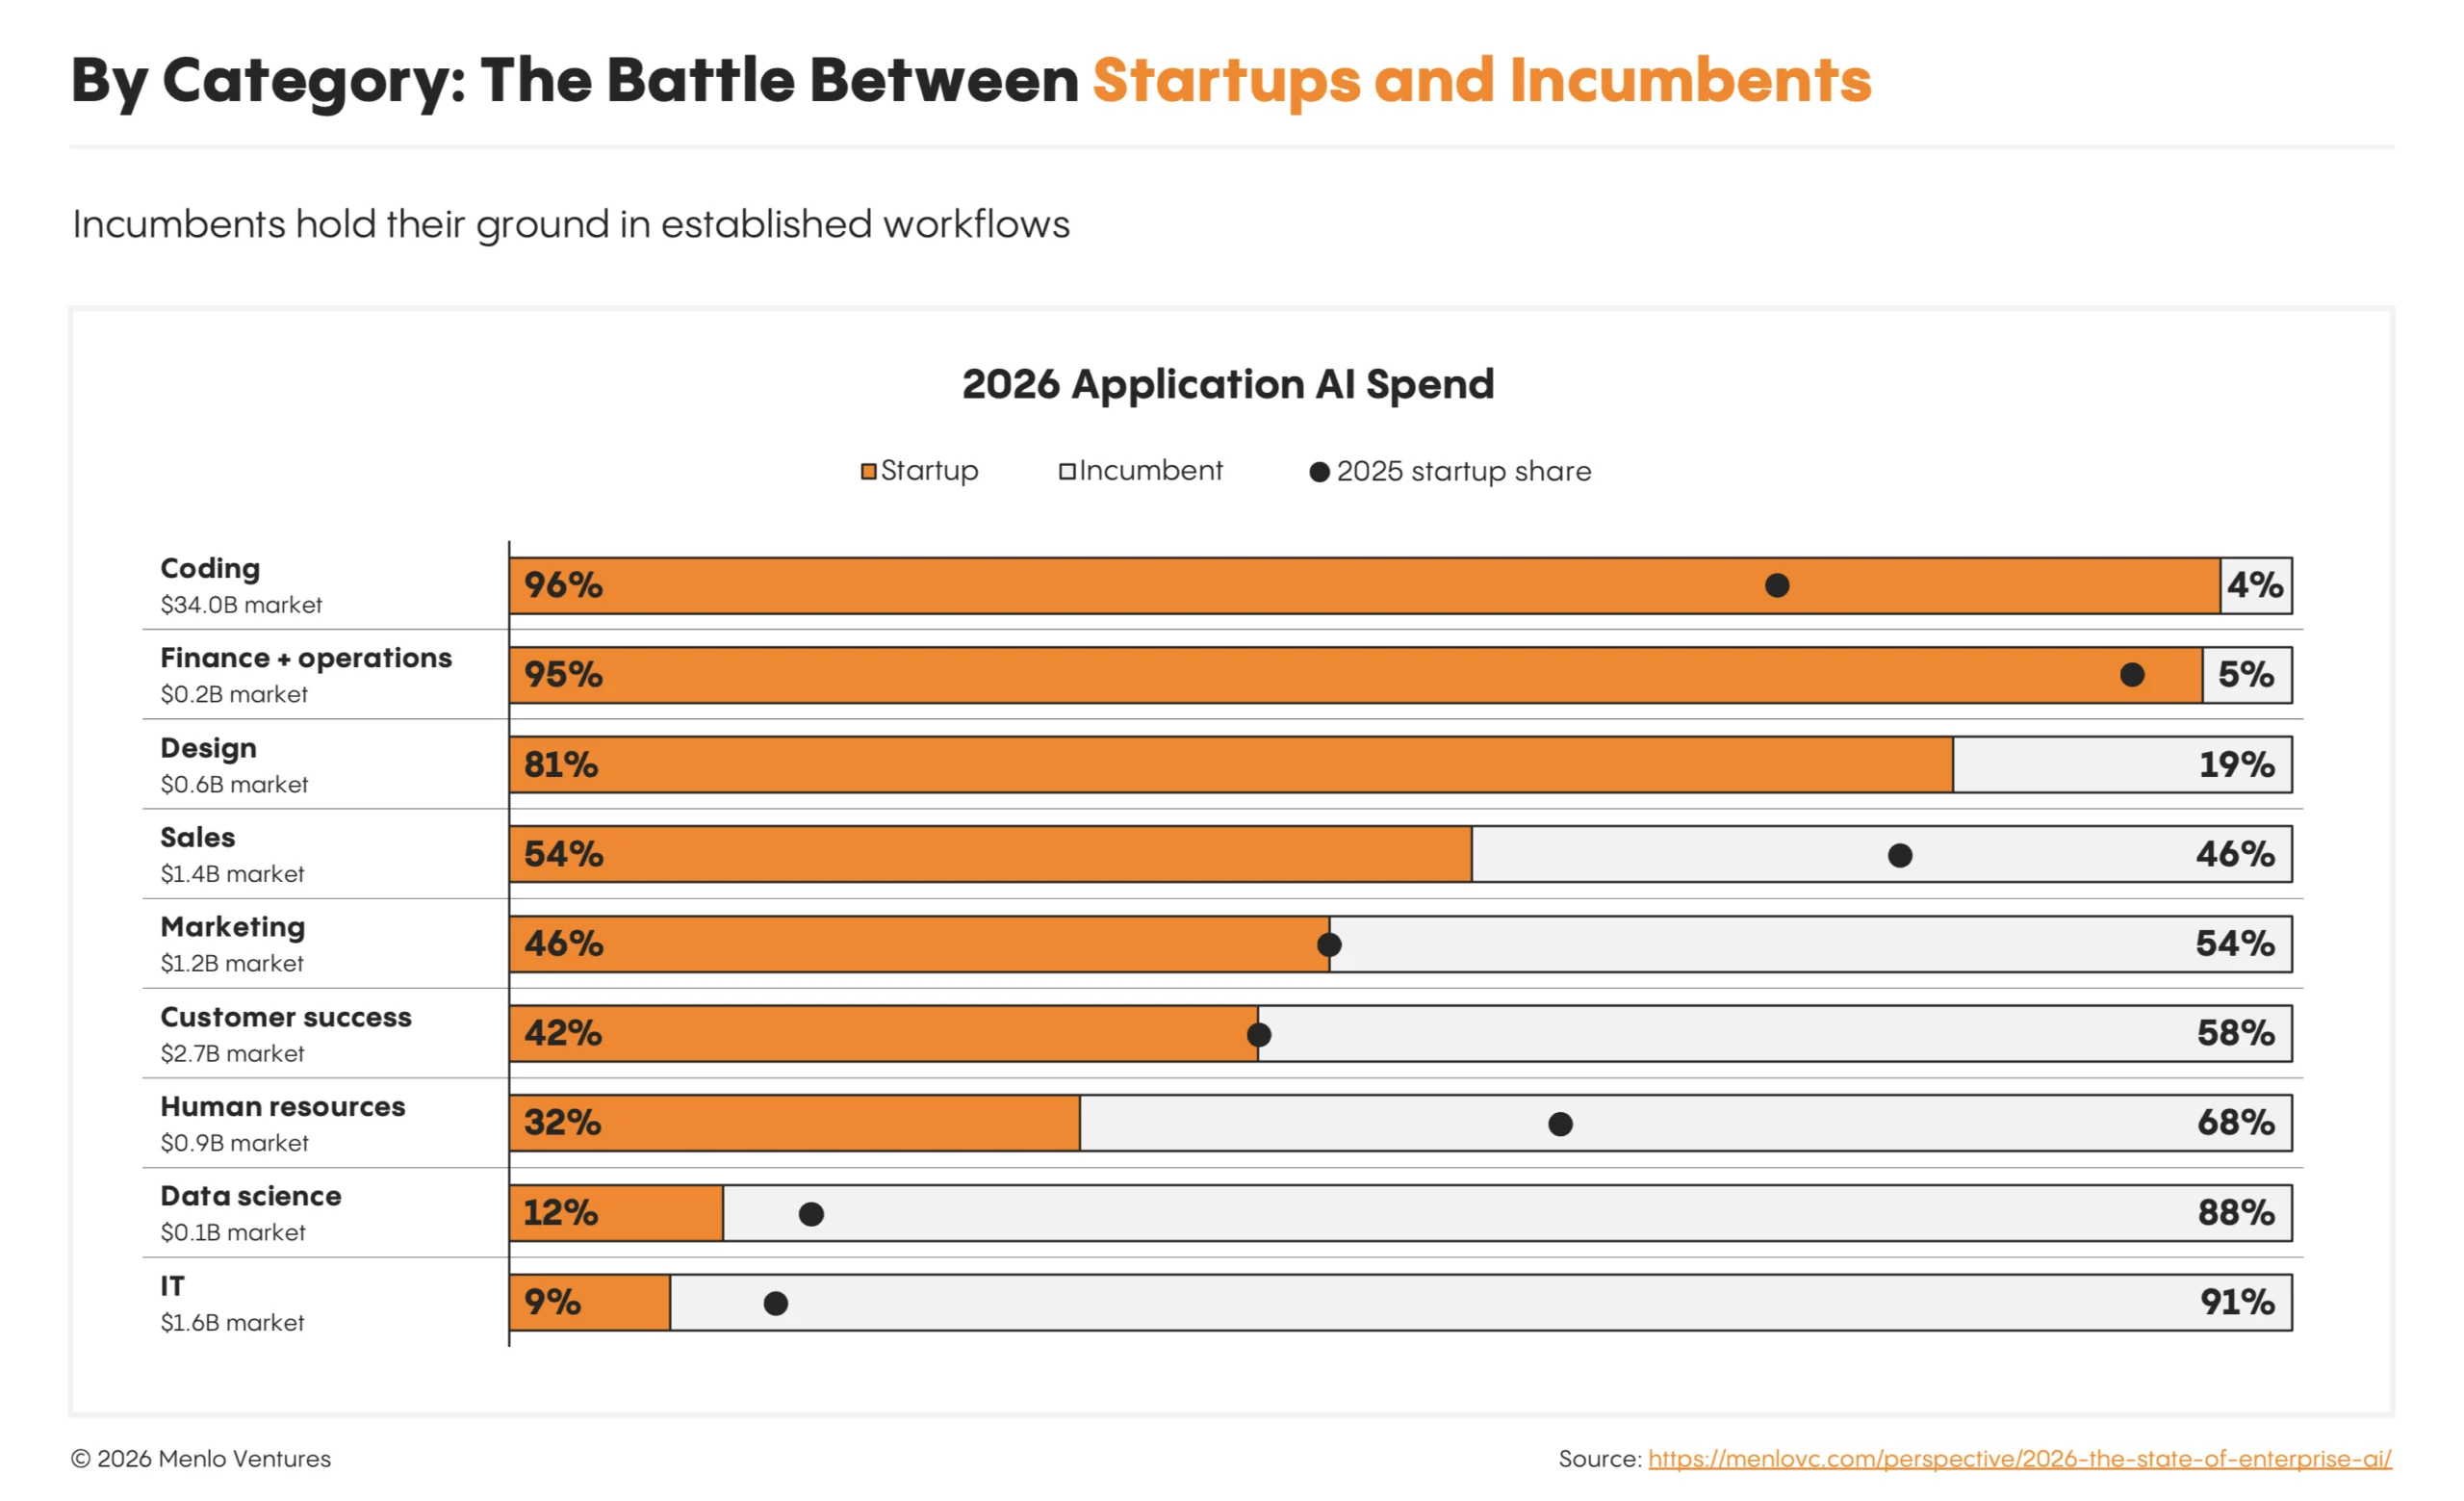
Coding shows why startups win. AI-native providers account for 96% of the $34B market, including the labs’ own products (Claude Code, Codex) as well as independent companies like Cognition and Factory. Against incumbent GitHub Copilot, the challengers won largely through their product velocity—quickly translating model advances into products that moved from completing lines of code to building entire features.
Cognition and Factory, for example, built their products around autonomous planning, execution, and testing. When Opus 4.5 arrived in November 2025, those systems were already in place to put its stronger capabilities to work.
On the other hand, incumbents hold their ground where they are the system of record and AI has to fit into established workflows—including IT (ServiceNow, 91%), data science (Databricks and Snowflake, 88%), and HR (Workday, 68%). In fact, after historically being outpaced by new entrants, we saw incumbents gain ground this year in nearly half of the categories we track.
Agents Are the Biggest New Consumers of Infrastructure
AI agents are becoming the standard way to build AI applications. Today, 74% of builders use agents to manage workflows and execute tasks, compared with 27% of startup deployments in 2025. Nearly a third (32%) are already using multiple agents working together.
This shift is reshaping infrastructure demand. Traditional software infrastructure was built primarily for applications used by people—human-paced, one session at a time, provisioned once and left running. Agents operate differently: They work at machine speed, run in parallel, spinning up and discarding resources as needed.
That creates two opportunities: Existing infrastructure must evolve to handle the speed and scale of AI-driven activity, while entirely new infrastructure categories are emerging to support new agent needs.
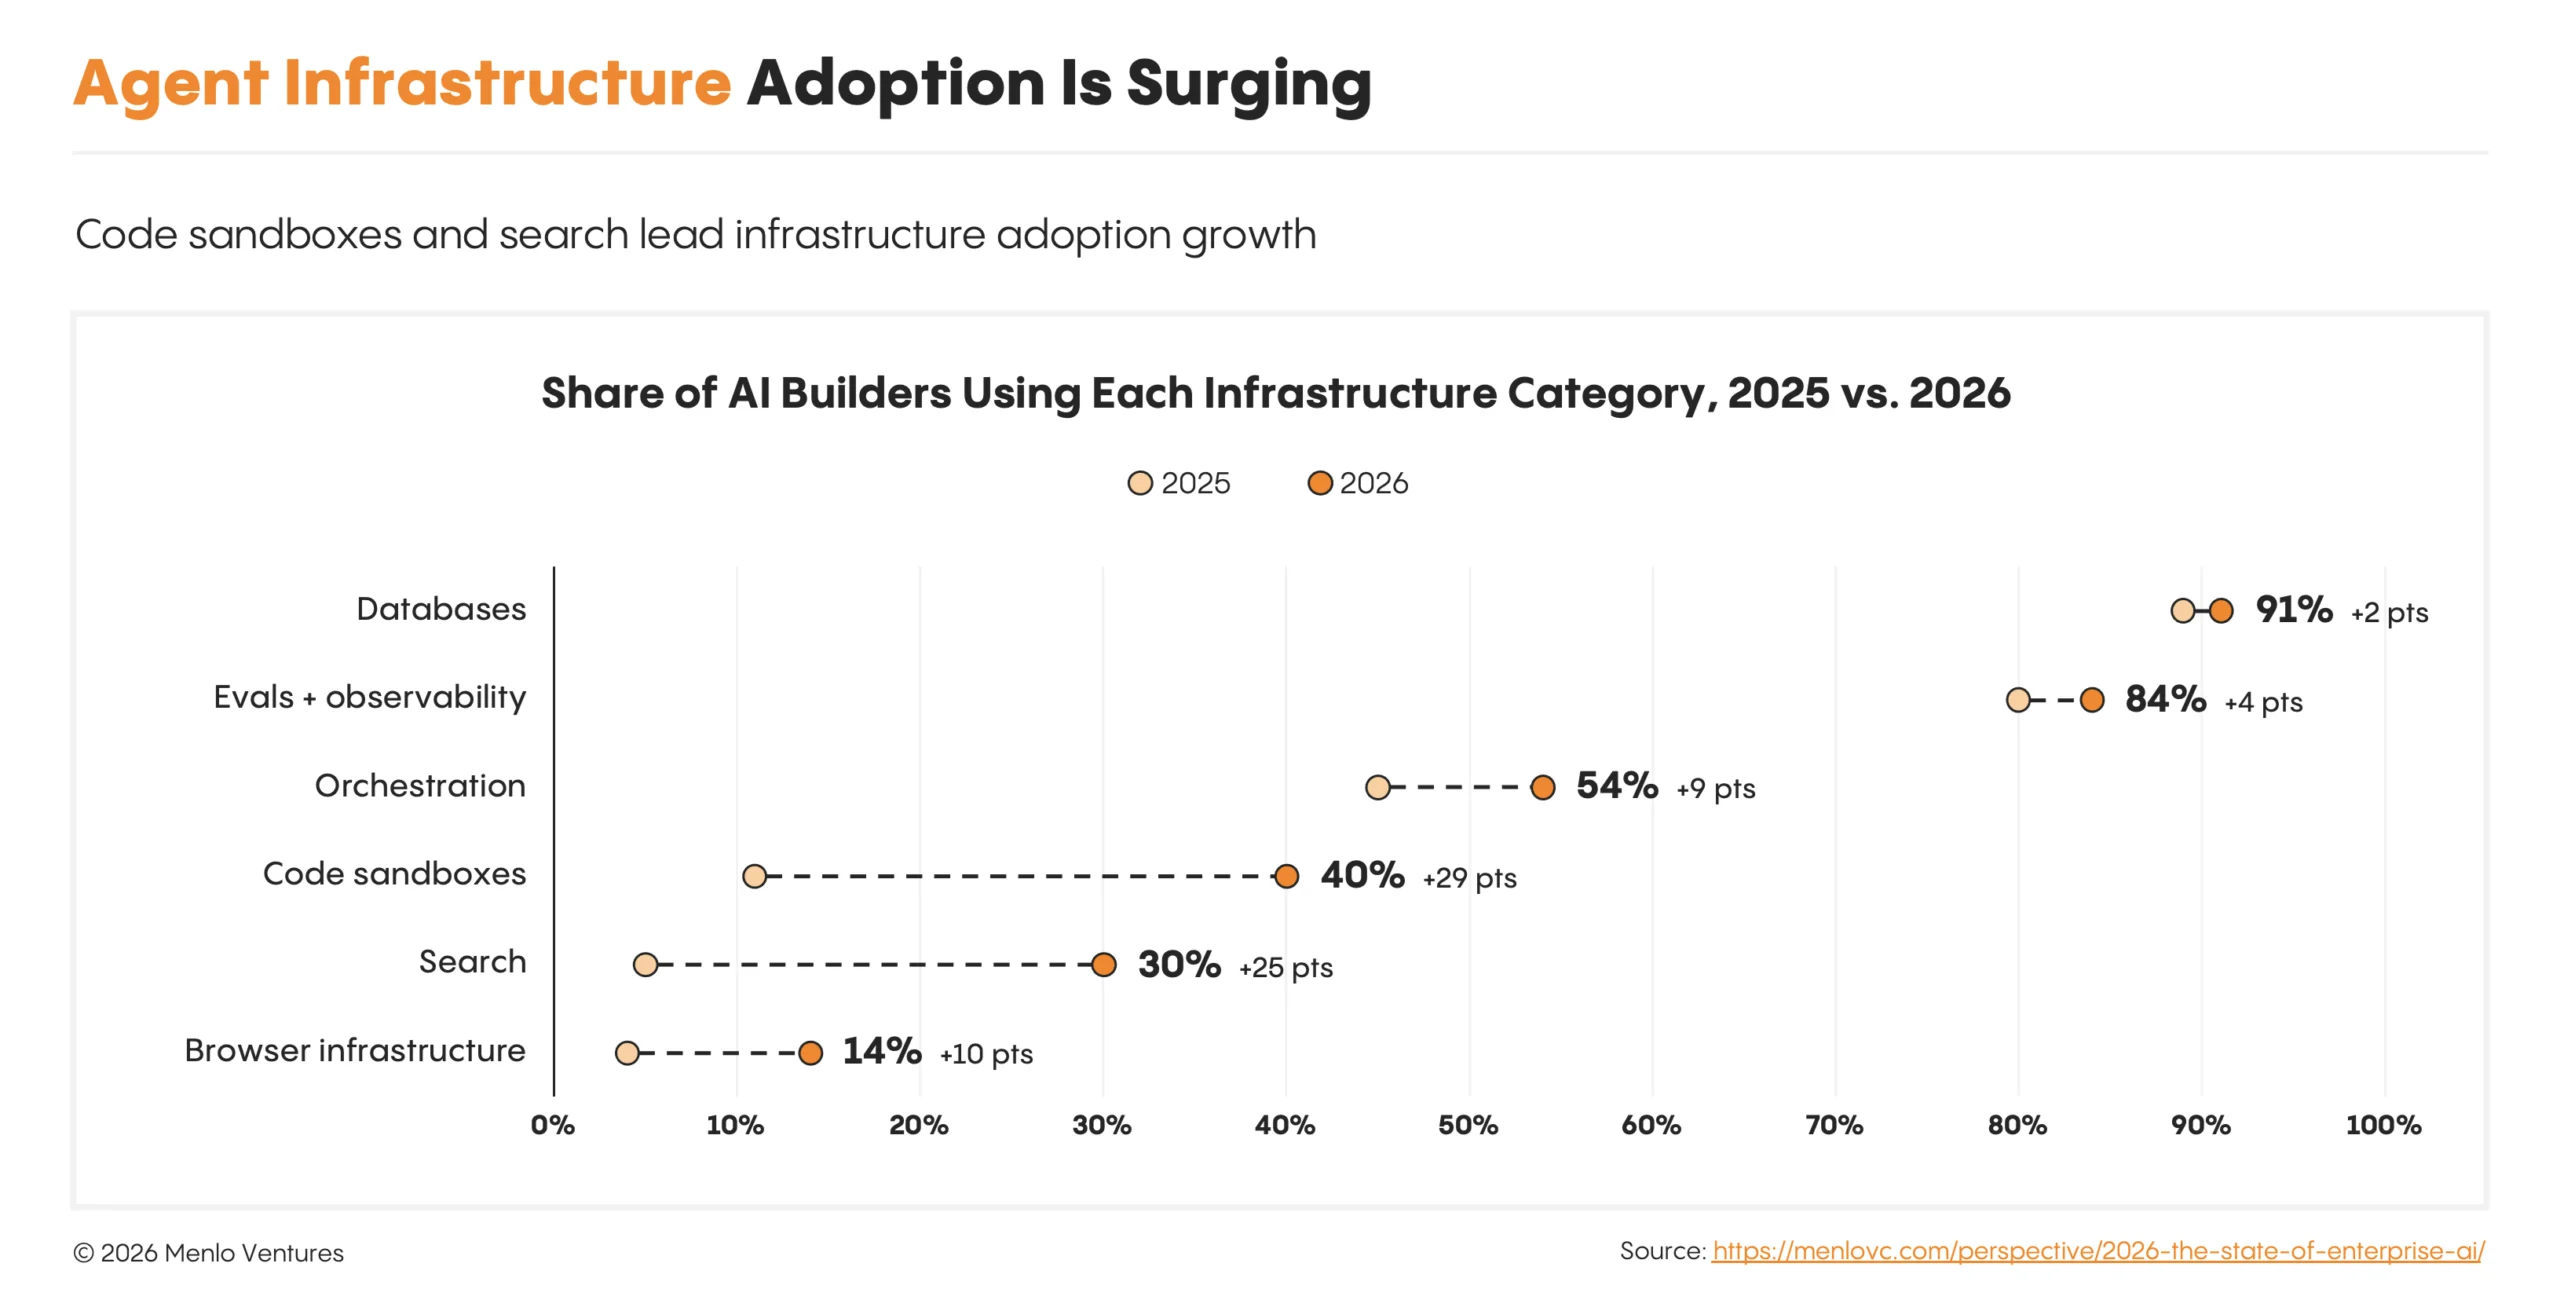
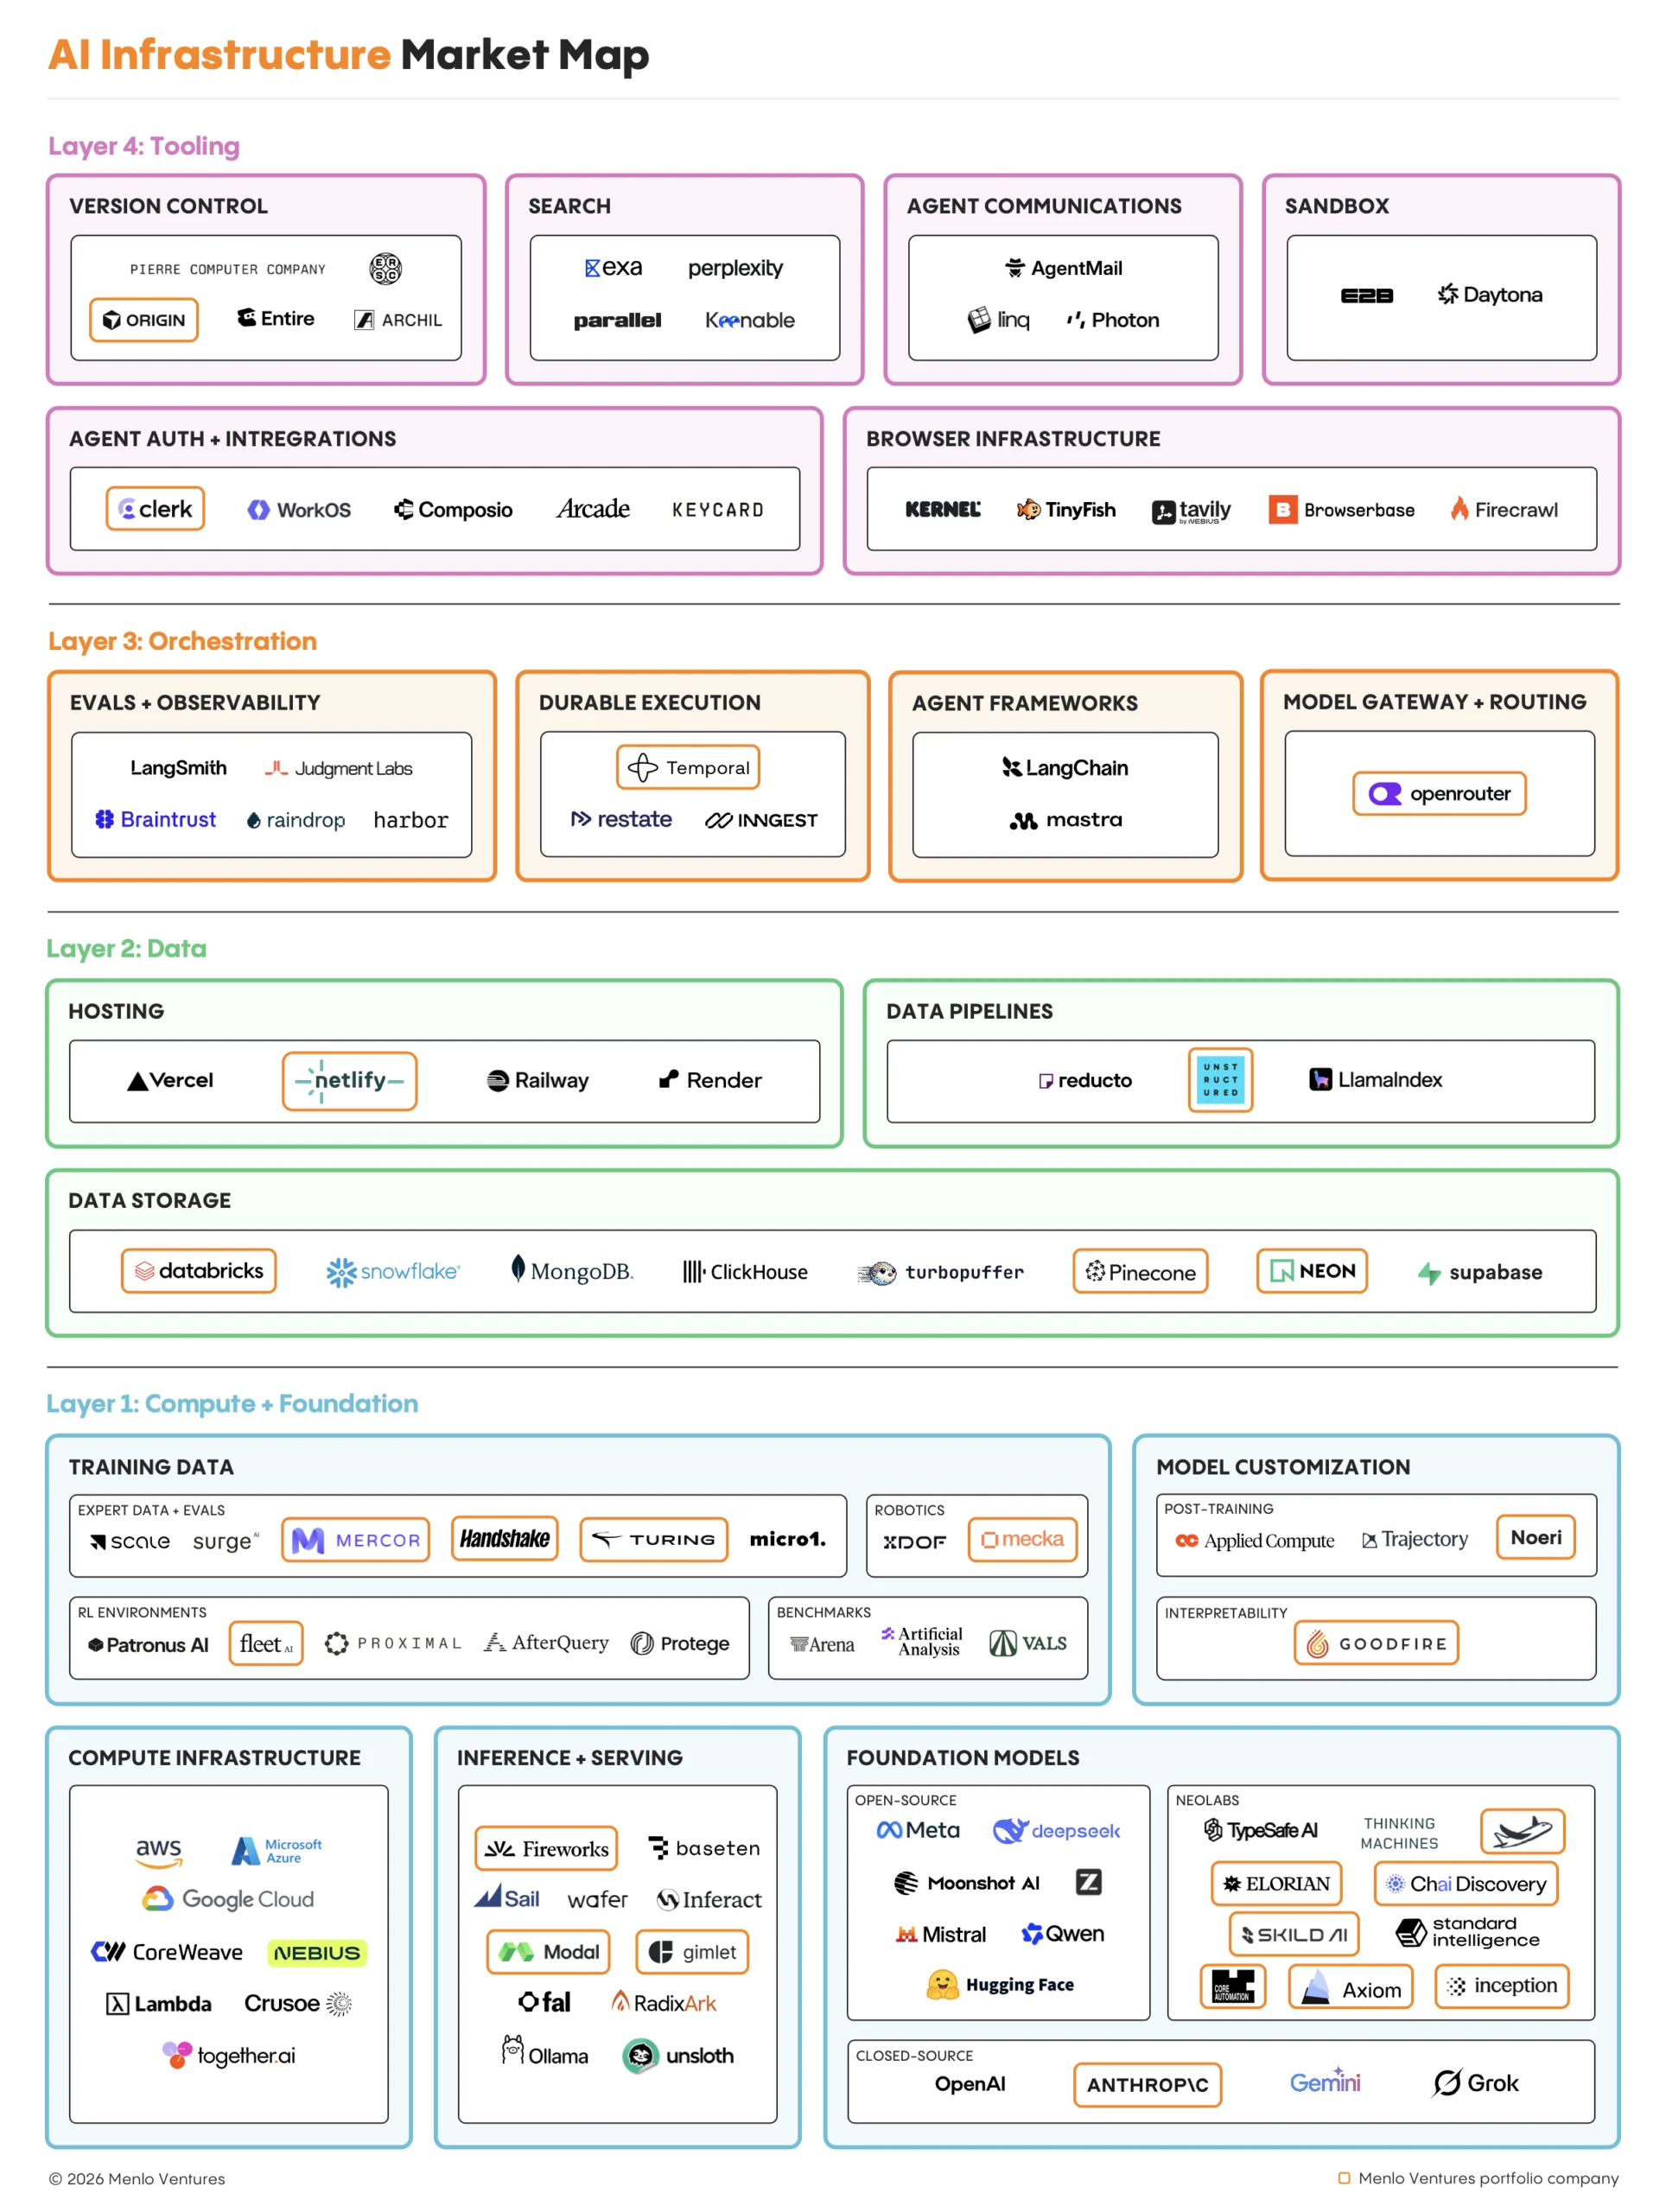
Established systems are being rebuilt for machine speed and scale. Databases are still the systems agents touch most (91% of AI apps), but they’re shifting from manually provisioned, long-lived systems behind applications that persist for years to high-volume, ephemeral ones that agents spin up, use, and discard for each task. The rise of providers like Neon*/Lakebase, Supabase, ClickHouse, and Archil shows this most strongly.
Agents are creating net-new infrastructure needs. Sandboxes (for coding agents to run untrusted code), search (for agents to retrieve information), and browser infrastructure (for personal agents to navigate the web) are the big winners: Code sandboxes rose from 11% to 40% of builders, search from 5% to 30%, and browser infrastructure from 4% to 14%.
Final Thoughts
Enterprise AI has grown from $33 billion to $177 billion in a single year, a 5.4x increase. Agents changed where dollars flow, which markets are working, and which models buyers choose, and we expect that capability-driven growth to continue as agents take on longer horizons, computer use, and multi-agent coordination.
But capability doesn’t stay scarce for long. Value moves to the app layer as companies emerge to translate raw intelligence into something a specific business or industry can use. Far from the SaaSpocalypse some feared, our study finds AI creates abundance in every market it touches—across frontier and open-source models, labs and independent apps.
At Menlo Ventures, we’re fortunate to partner with many of the companies at the forefront of this wave, including Anthropic at the frontier; Skild and Chai Discovery at the model layer; Fireworks, Modal, Gimlet, and OpenRouter at the infrastructure layer; Mercor and Fleet in training data; and Legora, Lovable, Factory, OpenEvidence, Eve, Assort Health, Wispr Flow, Suno, and Higgsfield at the app layer.
If you’re a founder looking to define what’s next in AI, we’d love to partner with you and build the future together.
Methodology
This is Menlo Ventures’ fourth annual State of Enterprise AI report. It draws on a survey of nearly 400 U.S. enterprise decision-makers responsible for more than $4 billion in AI spending, fielded by Morning Consult from September 8–26, 2026.
Market sizing. Dollar figures for total market size are Menlo Ventures estimates built from a bottoms-up model informed by survey responses, public filings, and third-party reports. Revenue is shown as annualized run rate. Figures for prior years were reclassified to reflect this year’s taxonomy, which moved data labeling vendors like Mercor from deployment to development.
LLM spend and token shares. LLM market shares represent estimated dollars spent based on proportion of production API usage. Survey respondents reported the share of their AI workloads using each model, weighted by AI spend. Token economics ($/M tokens) come from a bottoms-up model of token growth, informed by public revenue and token disclosures and triangulated against third-party sources including OpenRouter, Ramp, and Vercel.
Model tiers. Models are grouped by their position in each lab’s lineup. Models two or more generations behind the latest in their family are “older.” Specialized models include image, audio, cyber, and bio.
Q3 2026 tiers. Frontier includes GPT-6 Astra, GPT-5.6 Sol, GPT-5.5, and Anthropic’s Fable and Opus class models. Mid-tier includes GPT-6.1 Sol, GPT-6 Sol, GPT-5.6 Terra, and Anthropic’s Sonnet class. Small includes OpenAI’s Luna class, Anthropic’s Haiku class, and Google’s Gemini Flash.
Q3 2025 tiers. Frontier included GPT-5 Pro, Claude Opus 4/4.1, Sonnet 4.5, and Gemini 2.5 Pro. Mid-tier included GPT-5, Claude Sonnet 4, and Gemini 2.5 Flash. Small included OpenAI’s Mini and Nano models, Claude Haiku 3/3.5, and Gemini 2.5 Flash-Lite.
OpenRouter token data. Human vs. agent token trends draw on OpenRouter’s weekly token volumes by API-key type (agentic, human, mixed), September 1, 2025 to September 28, 2026. As a model-agnostic gateway now processing 160T+ weekly tokens, OpenRouter is a good indicator for broader patterns in AI usage, though its users skew more toward individual developers and startups than the enterprise buyers in Menlo’s survey.
*Menlo Ventures portfolio company

Tim is a partner at Menlo Ventures focused on early-stage investments that speak to his passion for AI/ML, the new data stack, and the next-generation cloud. His background as a technology builder, buyer, and seller informs his investments in companies like Neon (acquired by Databricks), Eve, Fleet, and Gimlet, among…

A self described “tall, slightly nerdy product guy,” Joff was previously the Chief Product Officer of Atlassian, responsible for leading its acclaimed portfolio of products, including Jira, Confluence, and Trello. During that time, Joff was named on the “Global CPO 20” list by Products That Count and as a “Top…

Deedy is a partner at Menlo Ventures focused on early-stage investments in AI/ML, next-generation infrastructure, and enterprise software. Having been an engineer and product leader at both a successful startup and large public companies, Deedy is well-equipped to help technical founders navigate how to build and scale enduring tech companies.…

As a principal at Menlo Ventures, Derek focuses on early-stage investments across AI, cloud infrastructure, and digital health. He partners with companies from seed through inflection, including Anthropic, Eve, Neon, and Unstructured. Derek joined Menlo from Bain & Company, where he advised technology investors on opportunities ranging from machine learning…