- Every company is a software company. Moreover, every company is now an AI/ML company. As this accelerates, models must be monitored and explained in the same way servers and other assets are monitored in order to maintain AI Quality.
- Models are deployed continuously, retrained, refined, and refactored, just like code. Many companies have models that are retrained and redeployed continuously, at minute-level frequency. With that frequency of change, how do you know if the predictions and decisions being made by these models are still correct and not costing your company millions?
- TruEra is the highest quality and most comprehensive AI Quality and ML Observability company we’ve seen; it has tons of novel, game-changing tech based on six years of research and papers by the world leaders of research in explainability.
Back when I was at Splunk, observability was (and continues to be) a very hot market with huge TAM opportunities. Pretty much any company that has servers (or any device emitting data at all) has opportunities for data to be collected, aggregated, and reported upon.



As enterprise workloads accelerated into the cloud over a decade ago, the need to monitor the behavior of workloads became a prime use case. As a developer or SRE, data is needed to know not only if your application is failing, but if it’s spiking, or even worse, dying. The move to the cloud brought huge benefits, but it also brought exponential complexity thanks to containers, multi-tenancy, orchestration, and serverless. Observability became as important to engineers as a compass, altimeter, and airspeed instrumentation are to a pilot.
This set of needs led to a generation of great companies leading the observability charge, including AppDynamics, New Relic, Splunk/SignalFx, DataDog, DynaTrace and many more. Observability instrumentation insertion points even went all the way down to the kernel level, suddenly making eBPF the hottest thing around, which nobody could have predicted a few years back.
Monitoring of ML Models
In parallel, machine learning and their models in production have accelerated in usage; we’re all familiar with this story. At this point, it’s nearly impossible to find any top consumer or enterprise application that isn’t powered by ML models in some way, shape, or form.
But in the same way servers and containers need to be monitored in the cloud, machine learning models also need to be monitored. How do you look for poor inference, data drift, data bias, and, perhaps more importantly, fairness? Fairness is an INCREDIBLY important topic which we will cover in depth later. One way to think about how models can inadvertently become biased, is to think about a favorite dataset—the Kaggle Titanic dataset. If this data isn’t treated properly, insurance actuaries would create lower insurance premiums on wealthier Titanic passengers because they could afford expensive (and safer) priced tickets closer to life rafts at deck level.
For more examples of black box models that can lead to concerns about fairness, look no further than:
- Apple Card credit line algorithms appearing to make unfair decisions
- COMPAS software that U.S. courts used to predict recidivism based on race.
“Effective monitoring of machine learning is one of the major missing pieces of IT management,” said Matthew Bennett, CIO, North America, HarperCollins Publishers, one of the first companies to deploy TruEra Monitoring. “We are excited about a solution that goes beyond current ad hoc tools and allows us to not only quickly and effectively identify emerging issues, but also debug and resolve them.”
One could argue that ML models are even more of a black box than servers, given the complexity of the variety of deep learning techniques with many hidden layers, as well as all other models in production today.
This is where TruEra comes in. Until now, most ML practitioners only looked at the accuracy of model performance against training data in the development phase. However, they didn’t have a sense of model performance in the real world, when the model was having the most impact on the business and its customers.
This is why TruEra created AI Quality. In the same way that DataDog offers observability on your server runtime, TruEra provides machine learning model monitoring AND explainability for your ML workloads—a must for any engineer deploying ML today.
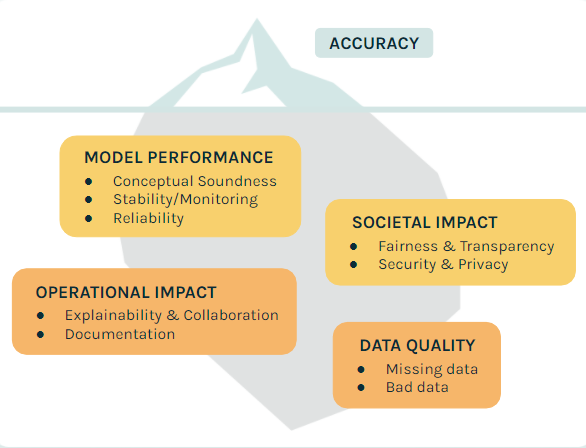
Data scientists, today, largely focus on model accuracy metrics, which are often very weak indicators of how well a model is actually going to fare in the real world. TruEra allows data scientists to easily test, debug and monitor models, and also provides a a comprehensive set of AI Quality characteristics.
Product Overview
On the Diagnostics page for TruEra, there’s a fantastic statement that provides the essence of what TruEra is about:
Transparency is everything—the AI black box is over
At its core, TruEra opens up the ML/AI black box and provides visibility and performance, inference causality, and monitoring, split across two main products: TruEra Diagnostics and TruEra Monitoring. As a user, you’ll finally be able to understand how a model functions, which is one of the largest AI challenges we have.
How do we differentiate between diagnostics and monitoring products?
- TruEra Diagnostics: Provides explainability and metrics that help report on model value and prove their effectiveness, from dev to production, including:
– Feature Analytics
– Segment Analysis
– Model Reliability and Stability
– Bias Analysis - TruEra Monitoring: Helps MLOps and Observability teams track and troubleshoot models, including:
– Model Performance
– Bias Tracking
– Root cause analysis on bias, stability, data quality
– Alerting / Triggers
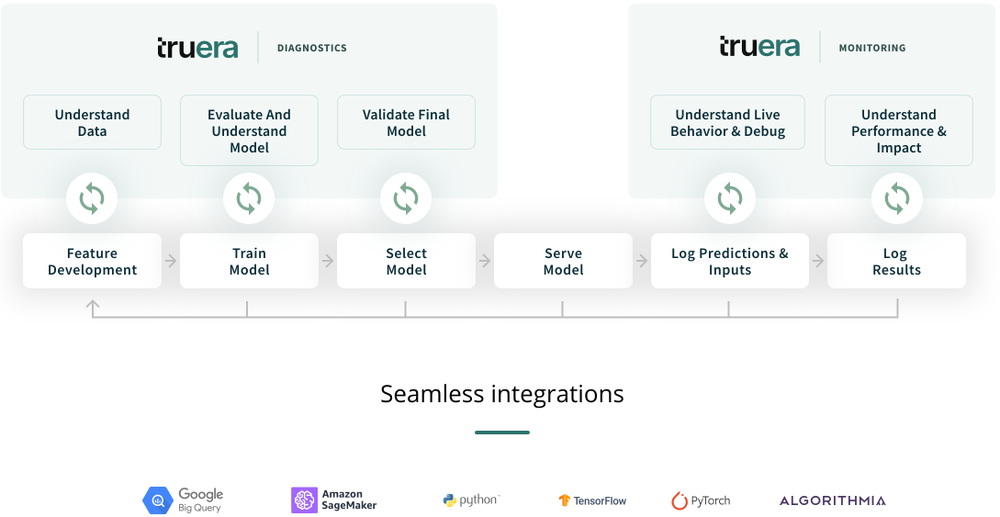
Additionally, you are effectively also getting an experimentation platform that allows you to track the performance of models across time, find which features drive inference within models, and monitor them for bias and drift.
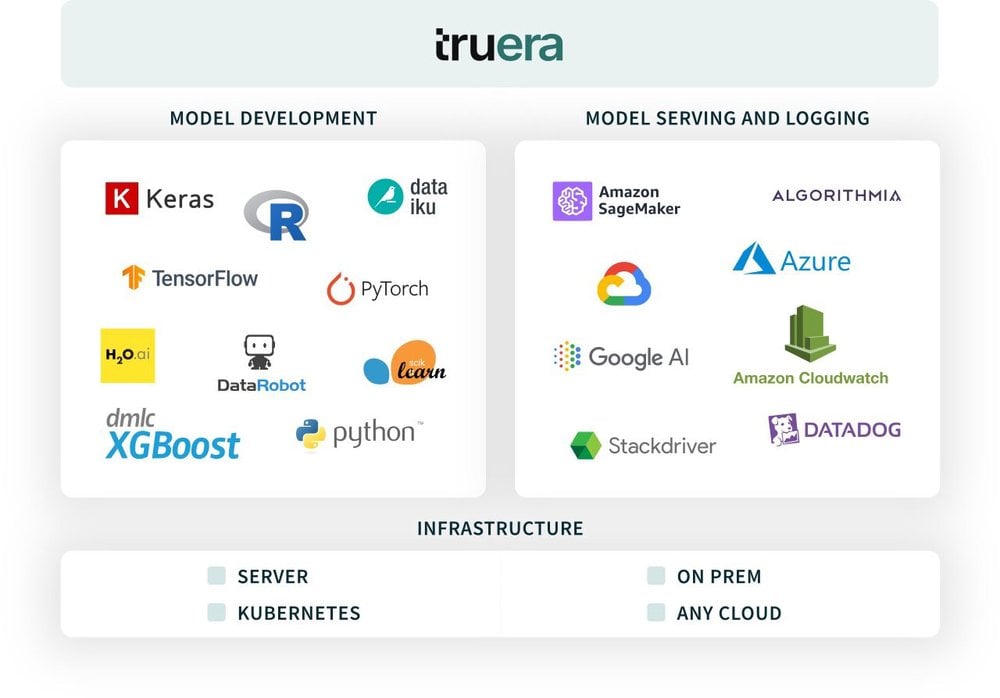
TruEra works on-prem or in a VPC across AWS, GCP, and Azure, supporting all of the using model training platforms such as Keras, Tensorflow, H20, PyTorch, and so on:
Before dropping directly into the product, let’s further define some of the challenges and resulting nomenclature in AI today—all addressed by TruEra:
Explainability: How does the model make decisions? Which factors are driving recommendations?
Bias: Was data used to train a model representing the population properly, and is it making decisions that work for one segment of the population but not another? For example, do model decisions work well for teenagers but unfairly bias against senior citizens? In a nutshell, AI bias is a regression in the results of ML training due to poor assumptions or prejudices introduced during model training. To learn more about AI bias, I highly recommend reading this fantastic article by Mary Pratt of TechTarget. In this article she calls out that one of the most important ways to prevent bias is by having proper monitoring in place.
Fairness: Somewhat related to bias, but are women less likely than men to get a loan from a bank’s AI? And how can this be solved?
Stability/Monitoring: How have world events such as Covid potentially affected our models? Is the model still fit for use? How can we react to future changes?
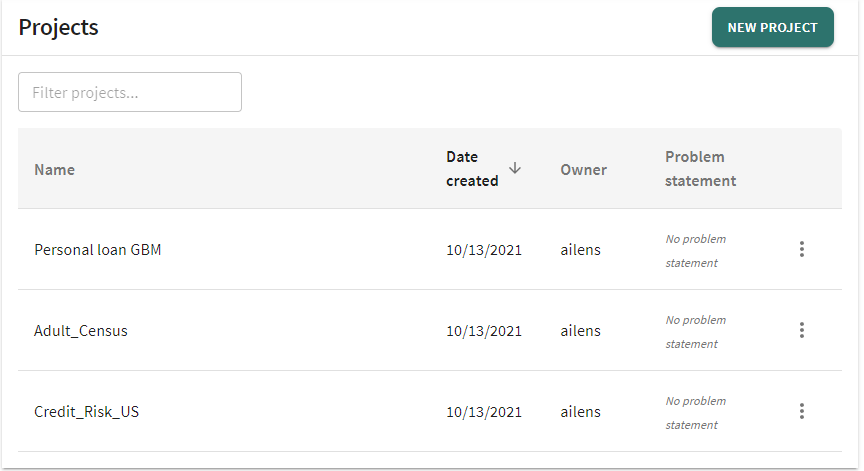
With that base, let’s walk through the product a bit and navigate our way through the UI. There’s a simple hierarchy to consider: projects and models. Models and model versions are within projects, as shown below.
Let’s look at the project overview dashboard, which has several models within it. First, let’s select a project:
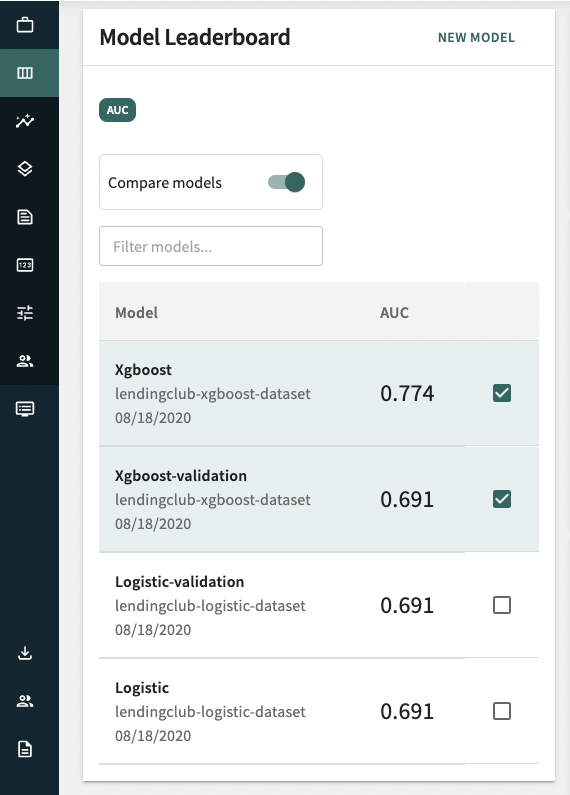
If we choose the Credit_Risk_US project, we can see the models in the project:
Model Monitoring
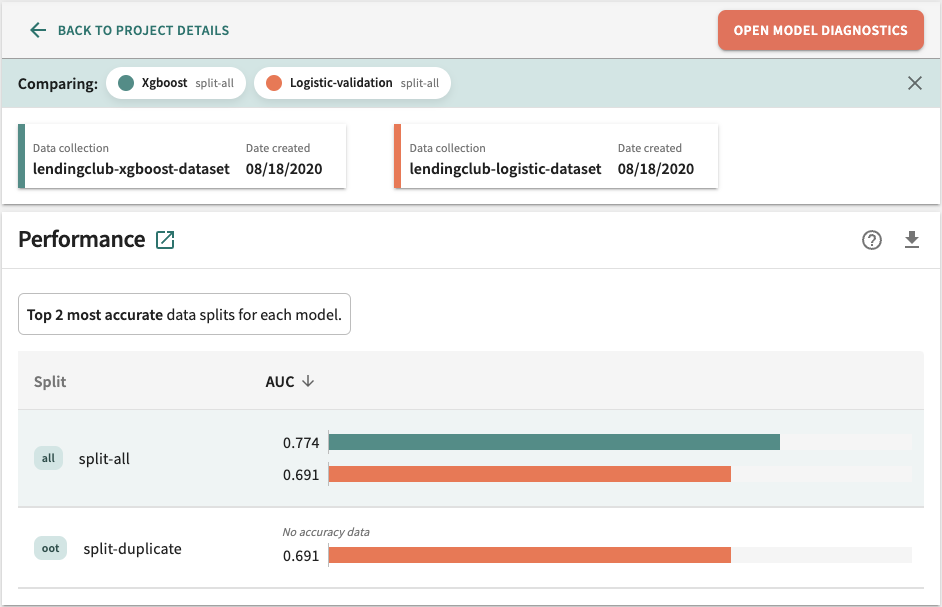
After selecting a project with models in it, we can monitor and compare them against each other, in particular using the AUC (area under curve) metric which is popular in classifiers:
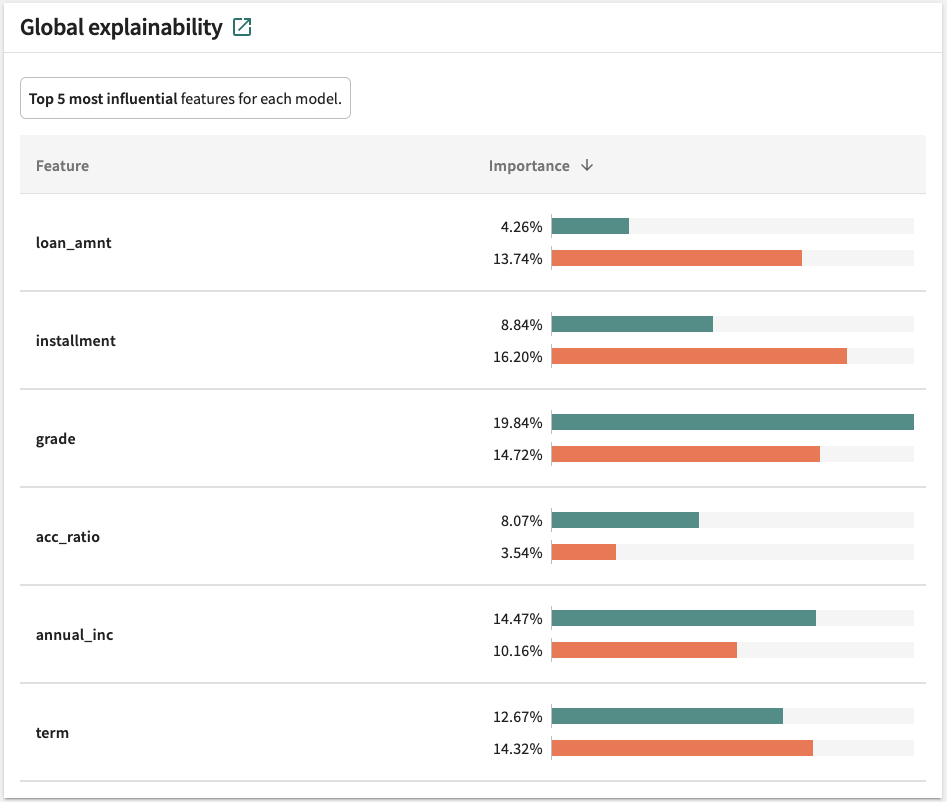
In addition to monitoring performance, ML engineers would want to monitor which features are most influential on each model:

For each machine learning model, TruEra provides a comprehensive dashboard of key metrics, including:
- Model Performance (actual or estimated)
- Model score drift
- Feature drift (model inputs)
- Bias: disparate impact
- Data quality trends (rule violations)
- Root cause analysis:
– Which features are contributing to model stability issues
– Which features drive bias
– Which features have data quality problems
– Which segments are thus impacted
– Data quality deviation from baseline - Alerts and Notifications
– Model stability
– Feature influence/stability
– Feature drift
– Bias
– Segment comparisons for all dimensions above
– Notifications for; email, PagerDuty, webhooks, Slack
Model Explainability
TruEra Diagnostics performs sophisticated sensitivity analysis that enables data scientists, business users, and risk and compliance teams to understand exactly why a model makes predictions. This part of the product is based on over six years of research performed at Carnegie Mellon University, research that continues at TruEra today. Model quality helps ensure models achieve the intended business impact. TruEra analyzes several facets of model quality including:
- Accuracy
- Generalization
- Conceptual soundness
- Stability
- Reliability
- Fairness
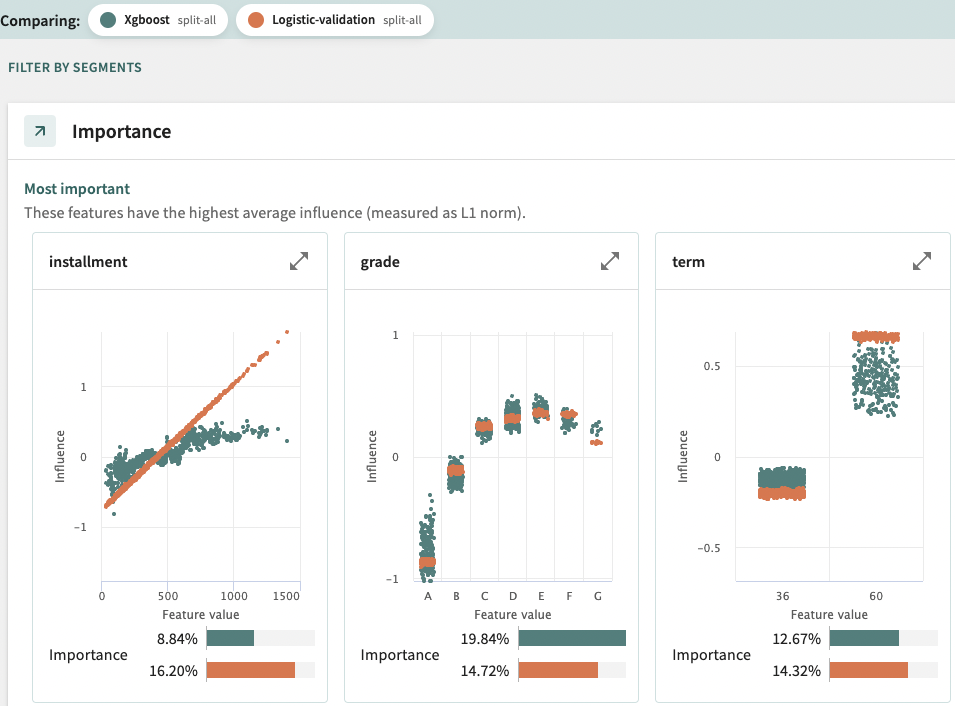
As an example, the screengrab below shows which features are driving and influencing certain scoring for credit risk:
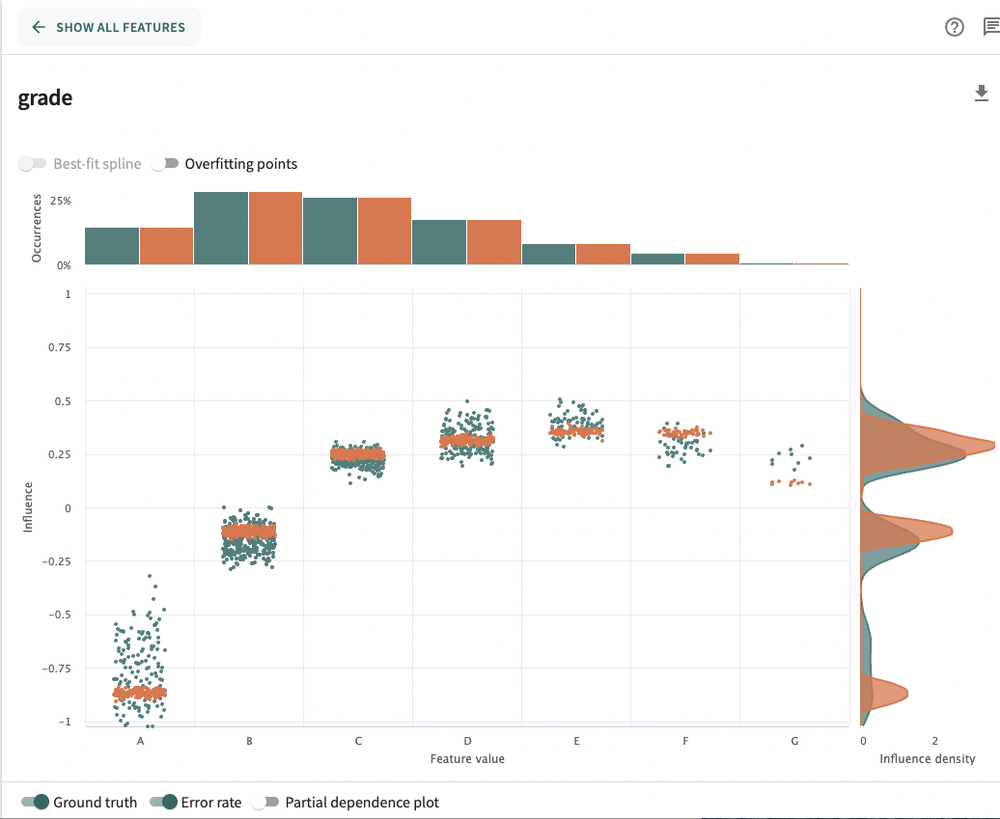
Now, if we decide we don’t like what we are seeing with the grade feature, we can double click into the model. Here, a low feature influence equates to lower risk and a high feature influence equates to more risk in the model.
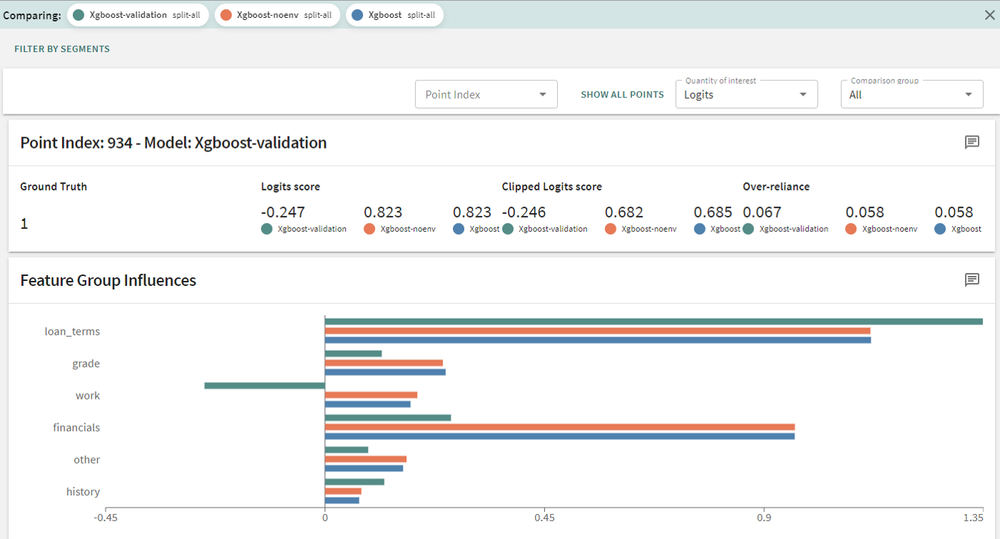
After that, you can go even lower by examining local feature importance, where we can now analyze feature influences for a specific data point (in this model that represents a person applying for a loan). In this example we will choose person 934 and look at which features influenced their scoring the most:
Ethical/Responsible AI
One of the most fascinating aspects of this part of the product is how it’s being used not just for picking the right model and how the weighting of features impacts scores. We spoke to Standard Chartered Bank in Singapore and learned that this feature is being used by their company-wide “Responsible-AI” initiative. Among other things, this initiative focuses on ensuring that the use of AI is fair and transparent. According to this press release, “The Bank is an active proponent of the use of artificial intelligence and data analytics to better support clients and stakeholders, and doing so in a responsible and trustworthy way that adheres to the pillars of fairness, ethics, transparency and self-accountability.”
TrueEra Platform
As mentioned above, I’m a huge fan of the more intelligent approach to the architecture of the platform. Many companies these days conveniently put 100% of the processing horsepower in the cloud, which is certainly convenient. However, the downside is cost and lower gross margins for such companies. And for the customer, that cost comes to them. Furthermore, egressing your data fully into the cloud means higher latency on anomaly detection and slower reporting.
To overcome this, Shayak Sen and Anupam Datta intelligently moved to a smart agent/library model, similar to another company I work with—Edge Delta. I was particularly impressed by this as the AI Quality problem on its own is challenging, but to be thoughtful as this about the underlying data architecture at the same time—that really blew me away. As you can imagine this leads to a more efficient processing pipeline in terms of speed, cost and latency to the user. You’ll hear more about the TruEra architecture from the team soon.
Getting Data In
Getting data in is by far and away the hardest problem in any data analytics system these days, SaaS or not. The approach with TruEra is not dissimilar from many of the other players. There is a Python based SDK that allows you to instrument data about the models, which is fairly straightforward and simple Python. Note that this work can also be done directly from a Jupyter notebook.


From there, you add a data collection. A data collection is a container for two related things:
- Data splits: A set of in-sample data (train, test, validate) or out-of-sample (OOS) / out-of-time (OOT) data to test model quality, stability, and generalizability.
- Feature Metadata: An (optional) set of metadata defining the set of features for a set of splits and the various models trained and evaluated on them. This allows you to group features and provide feature descriptions for use throughout the tool.

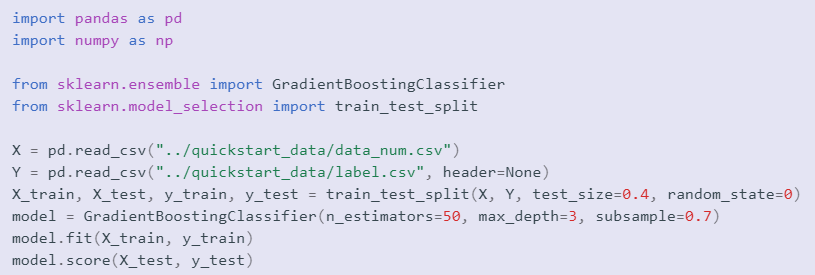
In the simple example below, we will boost (GradientBoost in this case) a model.
Now we can upload some data to our data collection to prepare for analyzing the model. Here we upload the entire data as an “all” split type. We could choose to upload and just the train or test datasets as “train” or “test” split types. At least one “train” or “all” split is required for generating analysis. You can have zero or more splits of other kinds. You upload a split by providing:
- A friendly name to identify the split (required).
- Input data in the shape the model expects (required). This can be a pandas DataFrame.
- Labels/target ground-truth values (optional).

This is the last step before we can start analyzing the model in TruEra dashboards. Model type and dependency versions are automatically inferred from the environment and the model object. A friendly name is provided to be able to find the model in the TruEra dashboard and be able to work with it in the future. The model is automatically attached to the current data collection.

Uploading Model Monitoring Data
There is a set of command-line tools and Python/REST APIs for uploading ‘split’ data to TruEra for viewing against the corresponding models as uploaded above.
Ecosystem Support
TruEra provides support for the most common ML frameworks used for model training:
- sklearn
- XGBoost
- CatBoost
- Tensorflow
- PyTorch
- H2O.ai
- PMML
- MLeap
The Team: Clear Technology Leaders in ML
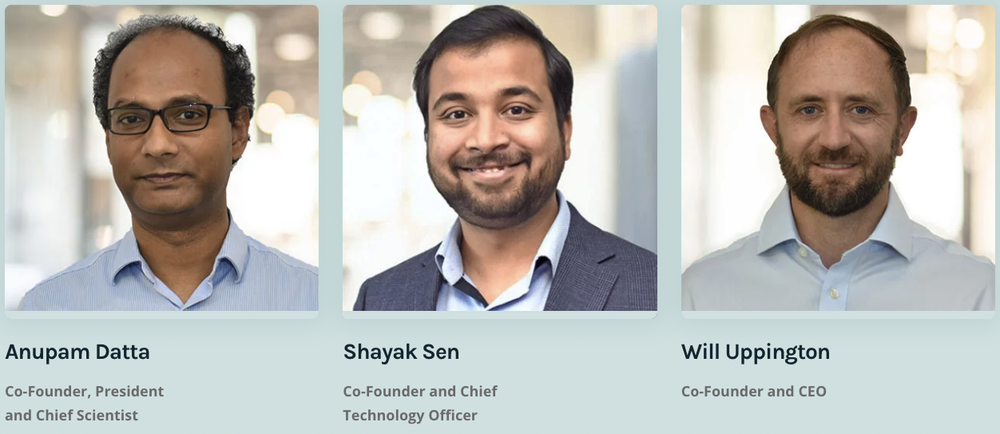
I was introduced to Will Uppington, Anupam Datta, and Shayak Sen through my partner Shawn Carolan, who has known Will forever. Our first meeting was in downtown Redwood City; it was scheduled to last 1 hour. I stayed for 2.5 hours and knew right away that this was the best ML monitoring and observability product I’d seen yet.
In particular, I loved that TruEra was approaching the problem as a deep technology problem, solving for monitoring and explainability in the deepest way possible, based on years of research. Anupam Datta and Shayak Sen worked together closely at Carnegie Mellon University, where Anupam is a CS professor and Shayak completed his PhD. They have created a set of proprietary technologies that provide incredible speed and depth around the explainability problem; they are not simply repackaging SHAP and putting a UI on it. As mentioned above, they’ve thought about the problem as not just an ML problem but as a broader data architecture problem, evidenced by their usage of edge-based processing.
Menlo Ventures is incredibly proud and excited to be a part of the TruEra team. Additionally we’re excited to join existing investors Greylock (seed) and Wing VC (Series A). We continually look for disruptive technologies with a mission-oriented team of thought leaders that move problems forward by an order of magnitude—we clearly achieved that here with TruEra and can’t wait to see what the future holds for the team!
Tim is a partner at Menlo Ventures focused on early-stage investments that speak to his passion for AI/ML, the new data stack, and the next-generation cloud. His background as a technology builder, buyer, and seller informs his investments in companies like Pinecone, Neon, Edge Delta, JuliaHub, TruEra, ClearVector, Squint, and…


